Thursday, July 29, 2010

Resveratrol blocks weight gain in primate study

Gray mouse lemur
Resveratrol—a natural red-wine compound previously shown to protect mice against excess weight gain when fed a high-fat diet—has now been found to reduce seasonal weight gain in gray mouse lemurs in a primate model of obesity.

The study was published in BMC Physiology by a team of researchers from the Centre Nationale de la Recherche Scientifique, Museum National d’Histoire Naturelle, of Paris, who wrote that they had “demonstrated for the first time the short-term effects of resveratrol on the metabolism of an heterothermic [with varying body temperatures] primate.”

Gray mouse lemurs are a species of prosimian primate that can double in weight (seasonal fattening) within a matter of weeks. This increase in energy reserves is induced by the arrival of shorter days and longer nights (shorter photoperiod), which serves as a means of adapting to the long dry winters in its natural environment in Madagascar.

When given four weeks of resveratrol supplementation at the time of pre-winter fattening (200 milligrams per kilogram per day), the gray mouse lemurs exhibited the following “significant effects on energy metabolism”:

Reduction in seasonal body-mass gain associated with an increase in resting metabolic rate of 29 percent while decreasing food calorie intake by 13 percent.

Strong reduction of daily heterothermia expression (changes of body temperature relating to season) with no change in the daily amount of locomotor activity.

An increased secretion of glucose-dependent insulinotropic polypeptide (a gut hormone known to induce insulin secretion) levels that may play an additive role in limiting body-mass gain.

The researchers concluded that, “resveratrol activates energy expenditure by inducing an increase in resting metabolic rate and a decrease in torpor [temporary hibernation] patterns that play key roles in energy saving in this primate. Moreover, resveratrol had a satiety effect in this primate that reduced their spontaneous food intake.”

Resveratrol’s effects are potentially due to stimulation of SIRT1, one of family of sirtuin enzymes, that has a direct role in fat metabolism. Calorie restriction and, recently, intermittent fasting have also been shown to activate SIRT1 activity.

Mouse Lemurs to Humans

In a prepared statement, Fabienne Aujard, a co-author of the study, wrote, “The physiological benefits of resveratrol are currently under intensive investigation, with recent work suggesting that it could be a good candidate for the development of obesity therapies.”

When asked through e-mail about how the study related to humans, Aujard replied that the main point of the study is that the gray mouse lemur is a non-human primate, “This species is genetically closer to human. The data obtained with this lemur should be more easily extrapolated to humans compared to rodent studies.”

Investigation conducted in humans have mainly studied bioavailability in lesser amounts, not in the high amounts given to the lemurs (equivalent of a human weighing 70 kilograms taking 14 grams of resveratrol). At present, the maximum single dose studied in humans has been 5 grams (70 milligrams per kilogram for a human of 70 kilograms).

“However, despite being a primate, the mouse lemur’s organism is certainly very different from that of a human because of its size and its seasonality,” writes Aujard. “The mouse lemur is a small animal and, like all small mammals, it has a very active metabolism, thus, a very important nutrient metabolism. Therefore, we believe that the doses to be ingested by human to reach the same long-term effects will certainly be lower than that given to lemurs.”

The general recommendation for humans is between 50 to 500 milligrams daily, which is safe as supported by human clinical studies. Although this study shows promising results, it is not yet known whether or not resveratrol will influence fat metabolism or body composition in humans.

Source: Dal-Pan A, Blanc S, Aujard F. Resveratrol suppresses body mass gain in a seasonal non-human primate model of obesity. BMC Physiol 2010;10:11.

Wednesday, July 28, 2010

If You Ever Had Doubts About Our Ancestors Eating Shellfish, See Curtis Marean's Feature

When the Sea Saved HumanityPowered by Ergo:Ux

Too much complexity! I like the simplicity of Ricky’s Weather Forecasting Stone

Too much complexity in the last few posts and related comments: multivariate analyses, path coefficients, nonparametric statistics, competing and interaction effects, explained variance, plant protein and colorectal cancer, the China Study, raw plant foods possibly giving people cancer unless they don’t …

I like simplicity though, and so does my mentor. I really like the simplicity of Ricky’s Weather Forecasting Stone. (See photo below, from … I will tell you in the comments section. Click on it to enlarge. Use the "CRTL" and "+" keys to zoom in, and CRTL" and "-" to zoom out.)


Can you guess who the gentleman on the photo is?

A few hints. He is a widely read and very smart blogger. He likes to eat a lot of saturated fat, and yet is very lean. If you do not read his blog, you should. Reading his blog is like heavy resistance exercise, for the brain. It is not much unlike doing an IQ test with advanced biology and physiology material mixed in, and a lot of joking around.

Like heavy resistance exercise, reading his blog is hard, but you fell pretty good after doing it.

Saturday, July 24, 2010

The China Study one more time: Are raw plant foods giving people cancer?

In this previous post I analyzed some data from the China Study that included counties where there were cases of schistosomiasis infection. Following one of Denise Minger’s suggestions, I removed all those counties from the data. I was left with 29 counties, a much smaller sample size. I then ran a multivariate analysis using WarpPLS (warppls.com), like in the previous post, but this time I used an algorithm that identifies nonlinear relationships between variables.

Below is the model with the results. (Click on it to enlarge. Use the "CRTL" and "+" keys to zoom in, and CRTL" and "-" to zoom out.) As in the previous post, the arrows explore associations between variables. The variables are shown within ovals. The meaning of each variable is the following: aprotein = animal protein consumption; pprotein = plant protein consumption; cholest = total cholesterol; crcancer = colorectal cancer.


What is total cholesterol doing at the right part of the graph? It is there because I am analyzing the associations between animal protein and plant protein consumption with colorectal cancer, controlling for the possible confounding effect of total cholesterol.

I am not hypothesizing anything regarding total cholesterol, even though this variable is shown as pointing at colorectal cancer. I am just controlling for it. This is the type of thing one can do in multivariate analyzes. This is how you “control for the effect of a variable” in an analysis like this.

Since the sample is fairly small, we end up with insignificant beta coefficients that would normally be statistically significant with a larger sample. But it helps that we are using nonparametric statistics, because they are still robust in the presence of small samples, and deviations from normality. Also the nonlinear algorithm is more sensitive to relationships that do not fit a classic linear pattern. We can summarize the findings as follows:

- As animal protein consumption increases, plant protein consumption decreases significantly (beta=-0.36; P<0.01). This is to be expected and helpful in the analysis, as it differentiates somewhat animal from plant protein consumers. Those folks who got more of their protein from animal foods tended to get significantly less protein from plant foods.

- As animal protein consumption increases, colorectal cancer decreases, but not in a statistically significant way (beta=-0.31; P=0.10). The beta here is certainly high, and the likelihood that the relationship is real is 90 percent, even with such a small sample.

- As plant protein consumption increases, colorectal cancer increases significantly (beta=0.47; P<0.01). The small sample size was not enough to make this association insignificant. The reason is that the distribution pattern of the data here is very indicative of a real association, which is reflected in the low P value.

Remember, these results are not confounded by schistosomiasis infection, because we are only looking at counties where there were no cases of schistosomiasis infection. These results are not confounded by total cholesterol either, because we controlled for that possible confounding effect. Now, control variable or not, you would be correct to point out that the association between total cholesterol and colorectal cancer is high (beta=0.58; P=0.01). So let us take a look at the shape of that association:


Does this graph remind you of the one on this post; the one with several U curves? Yes. And why is that? Maybe it reflects a tendency among the folks who had low cholesterol to have more cancer because the body needs cholesterol to fight disease, and cancer is a disease. And maybe it reflects a tendency among the folks who have high total cholesterol to do so because total cholesterol (and particularly its main component, LDL cholesterol) is in part a marker of disease, and cancer is often a culmination of various metabolic disorders (e.g., the metabolic syndrome) that are nothing but one disease after another.

To believe that total cholesterol causes colorectal cancer is nonsensical because total cholesterol is generally increased by consumption of animal products, of which animal protein consumption is a proxy. (In this reduced dataset, the linear univariate correlation between animal protein consumption and total cholesterol is a significant and positive 0.36.) And animal protein consumption seems to be protective again colorectal cancer in this dataset (negative association on the model graph).

Now comes the part that I find the most ironic about this whole discussion in the blogosphere that has been going on recently about the China Study; and the answer to the question posed in the title of this post: Are raw plant foods giving people cancer? If you think that the answer is “yes”, think again. The variable that is strongly associated with colorectal cancer is plant protein consumption.

Do fruits, veggies, and other plant foods that can be consumed raw have a lot of protein?

With a few exceptions, like nuts, they do not. Most raw plant foods have trace amounts of protein, especially when compared with foods made from refined grains and seeds (e.g., wheat grains, soybean seeds). So the contribution of raw fruits and veggies in general could not have influenced much the variable plant protein consumption. To put this in perspective, the average plant protein consumption per day in this dataset was 63 g; even if they were eating 30 bananas a day, the study participants would not get half that much protein from bananas.

Refined foods made from grains and seeds are made from those plant parts that the plants absolutely do not “want” animals to eat. They are the plants’ “children” or “children’s nutritional reserves”, so to speak. This is why they are packed with nutrients, including protein and carbohydrates, but also often toxic and/or unpalatable to animals (including humans) when eaten raw.

But humans are so smart; they learned how to industrially refine grains and seeds for consumption. The resulting human-engineered products (usually engineered to sell as many units as possible, not to make you healthy) normally taste delicious, so you tend to eat a lot of them. They also tend to raise blood sugar to abnormally high levels, because industrial refining makes their high carbohydrate content easily digestible. Refined foods made from grains and seeds also tend to cause leaky gut problems, and autoimmune disorders like celiac disease. Yep, we humans are really smart.

Thanks again to Dr. Campbell and his colleagues for collecting and compiling the China Study data, and to Ms. Minger for making the data available in easily downloadable format and for doing some superb analyses herself.

Thursday, July 22, 2010

The China Study again: A multivariate analysis suggesting that schistosomiasis rules!

In the comments section of Denise Minger’s post on July 16, 2010, which discusses some of the data from the China Study (as a follow up to a previous post on the same topic), Denise herself posted the data she used in her analysis. This data is from the China Study. So I decided to take a look at that data and do a couple of multivariate analyzes with it using WarpPLS (warppls.com).

First I built a model that explores relationships with the goal of testing the assumption that the consumption of animal protein causes colorectal cancer, via an intermediate effect on total cholesterol. I built the model with various hypothesized associations to explore several relationships simultaneously, including some commonsense ones. Including commonsense relationships is usually a good idea in exploratory multivariate analyses.

The model is shown on the graph below, with the results. (Click on it to enlarge. Use the "CRTL" and "+" keys to zoom in, and CRTL" and "-" to zoom out.) The arrows explore causative associations between variables. The variables are shown within ovals. The meaning of each variable is the following: aprotein = animal protein consumption; pprotein = plant protein consumption; cholest = total cholesterol; crcancer = colorectal cancer.


The path coefficients (indicated as beta coefficients) reflect the strength of the relationships; they are a bit like standard univariate (or Pearson) correlation coefficients, except that they take into consideration multivariate relationships (they control for competing effects on each variable). A negative beta means that the relationship is negative; i.e., an increase in a variable is associated with a decrease in the variable that it points to.

The P values indicate the statistical significance of the relationship; a P lower than 0.05 means a significant relationship (95 percent or higher likelihood that the relationship is real). The R-squared values reflect the percentage of explained variance for certain variables; the higher they are, the better the model fit with the data. Ignore the “(R)1i” below the variable names; it simply means that each of the variables is measured through a single indicator (or a single measure; that is, the variables are not latent variables).

I should note that the P values have been calculated using a nonparametric technique, a form of resampling called jackknifing, which does not require the assumption that the data is normally distributed to be met. This is good, because I checked the data, and it does not look like it is normally distributed. So what does the model above tell us? It tells us that:

- As animal protein consumption increases, colorectal cancer decreases, but not in a statistically significant way (beta=-0.13; P=0.11).

- As animal protein consumption increases, plant protein consumption decreases significantly (beta=-0.19; P<0.01). This is to be expected.

- As plant protein consumption increases, colorectal cancer increases significantly (beta=0.30; P=0.03). This is statistically significant because the P is lower than 0.05.

- As animal protein consumption increases, total cholesterol increases significantly (beta=0.20; P<0.01). No surprise here. And, by the way, the total cholesterol levels in this study are quite low; an overall increase in them would probably be healthy.

- As plant protein consumption increases, total cholesterol decreases significantly (beta=-0.23; P=0.02). No surprise here either, because plant protein consumption is negatively associated with animal protein consumption; and the latter tends to increase total cholesterol.

- As total cholesterol increases, colorectal cancer increases significantly (beta=0.45; P<0.01). Big surprise here!

Why the big surprise with the apparently strong relationship between total cholesterol and colorectal cancer? The reason is that it does not make sense, because animal protein consumption seems to increase total cholesterol (which we know it usually does), and yet animal protein consumption seems to decrease colorectal cancer.

When something like this happens in a multivariate analysis, it usually is due to the model not incorporating a variable that has important relationships with the other variables. In other words, the model is incomplete, hence the nonsensical results. As I said before in a previous post, relationships among variables that are implied by coefficients of association must also make sense.

Now, Denise pointed out that the missing variable here possibly is schistosomiasis infection. The dataset that she provided included that variable, even though there were some missing values (about 28 percent of the data for that variable was missing), so I added it to the model in a way that seems to make sense. The new model is shown on the graph below. In the model, schisto = schistosomiasis infection.


So what does this new, and more complete, model tell us? It tells us some of the things that the previous model told us, but a few new things, which make a lot more sense. Note that this model fits the data much better than the previous one, particularly regarding the overall effect on colorectal cancer, which is indicated by the high R-squared value for that variable (R-squared=0.73). Most notably, this new model tells us that:

- As schistosomiasis infection increases, colorectal cancer increases significantly (beta=0.83; P<0.01). This is a MUCH STRONGER relationship than the previous one between total cholesterol and colorectal cancer; even though some data on schistosomiasis infection for a few counties is missing (the relationship might have been even stronger with a complete dataset). And this strong relationship makes sense, because schistosomiasis infection is indeed associated with increased cancer rates. More information on schistosomiasis infections can be found here.

- Schistosomiasis infection has no significant relationship with these variables: animal protein consumption, plant protein consumption, or total cholesterol. This makes sense, as the infection is caused by a worm that is not normally present in plant or animal food, and the infection itself is not specifically associated with abnormalities that would lead one to expect major increases in total cholesterol.

- Animal protein consumption has no significant relationship with colorectal cancer. The beta here is very low, and negative (beta=-0.03).

- Plant protein consumption has no significant relationship with colorectal cancer. The beta for this association is positive and nontrivial (beta=0.15), but the P value is too high (P=0.20) for us to discard chance within the context of this dataset. A more targeted dataset, with data on specific plant foods (e.g., wheat-based foods), could yield different results – maybe more significant associations, maybe less significant.

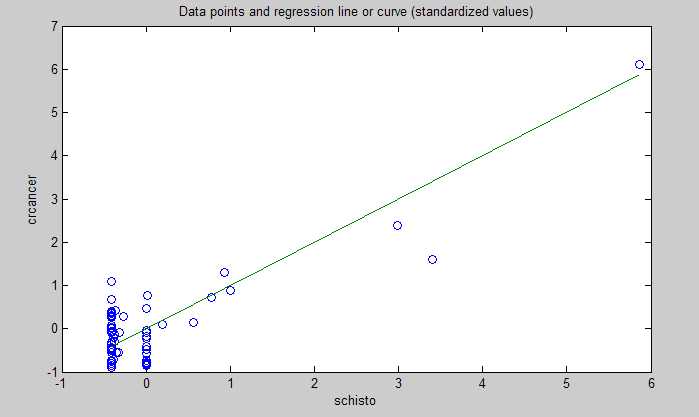
Below is the plot showing the relationship between schistosomiasis infection and colorectal cancer. The values are standardized, which means that the zero on the horizontal axis is the mean of the schistosomiasis infection numbers in the dataset. The shape of the plot is the same as the one with the unstandardized data. As you can see, the data points are very close to a line, which suggests a very strong linear association.


So, in summary, this multivariate analysis vindicates pretty much everything that Denise said in her July 16, 2010 post. It even supports Denise’s warning about jumping to conclusions too early regarding the possible relationship between wheat consumption and colorectal cancer (previously highlighted by a univariate analysis). Not that those conclusions are wrong; they may well be correct.

This multivariate analysis also supports Dr. Campbell’s assertion about the quality of the China Study data. The data that I analyzed was already grouped by county, so the sample size (65 cases) was not so high as to cast doubt on P values. (Having said that, small samples create problems of their own, such as low statistical power and an increase in the likelihood of error-induced bias.) The results summarized in this post also make sense in light of past empirical research.

It is very good data; data that needs to be properly analyzed!

Tuesday, July 20, 2010

My transformation: I cannot remember the last time I had a fever

The two photos below (click to enlarge) were taken 4 years apart. The one on the left was taken in 2006, when I weighed 210 lbs (95 kg). Since my height is 5 ft 8 in, at that weight I was an obese person, with over 30 percent body fat. The one on the right was taken in 2010, at a weight of 150 lbs (68 kg) and about 13 percent body fat. I think I am a bit closer to the camera on the right, so the photos are not exactly on the same scale. For a more recent transformation update, see this post.


My lipids improved from borderline bad to fairly good numbers, as one would expect, but the two main changes that I noticed were in terms of illnesses and energy levels. I have not had a fever in a long time. I simply cannot remember when it was the last time that I had to stay in bed because of an illness. I only remember that I was fat then. Also, I used to feel a lot more tired when I was fat. Now I seem to have a lot of energy, almost all the time.

In my estimation, I was obese or overweight for about 10 years, and was rather careless about it. A lot of that time I weighed in the 190s; with a peak weight of 210 lbs. Given that, I consider myself lucky not to have had major health problems by now, like diabetes or cancer. A friend of mine who is a doctor told me that I probably had some protection due to the fact that, when I was fat, I was fat everywhere. My legs, for example, were fat. So were my arms and face. In other words, I lot of the fat was subcutaneous, and reasonably distributed. In fact, most people do not believe me when I say that I weighed 210 lbs when that photo was taken in 2006; but maybe they are just trying to be nice.

If you are not obese, you should do everything you can to avoid reaching that point. Among other things, your chances of having cancer will skyrocket.

So, I lost a whopping 60 lbs (27 kg) over about 2-3 years. That is not so radical; about 1.6-2.5 lbs per month. There were plateaus with no weight loss, and even a few periods with weight gain. Perhaps because of that and the slow weight loss, I had none of the problems usually associated with body responses to severe calorie restriction, such as hypothyroidism. I remember a short period when I felt a little weak and miserable; I was doing exercise after long fasts (20 h or so), and not eating enough afterwards. I did that for a couple of weeks and decided against the idea.

There are no shortcuts with body fat loss, it seems. Push it too hard and the body will react; compensatory adaptation at work.

My weight has been stable, at around 150 lbs, for a little less than 2 years now.

What did I do to lose 60 lbs? I did a number of things at different points in time. I measured various variables (e.g., intake of macronutrients, weight, body fat, HDL cholesterol etc.) and calculated associations, using a prototype version of HealthCorrelator for Excel (HCE). Based on all that, I am pretty much convinced that the main factors were the following:

- Complete removal of foods rich in refined carbohydrates and sugars from my diet, plus almost complete removal of plant foods that I cannot eat raw. (I do cook some plant foods, but avoid the ones I cannot eat raw; with a few exceptions like sweet potato.) That excluded most seeds and grains from my diet, since they can only be eaten after cooking.

- Complete removal of vegetable oils rich in omega-6 fats from my diet. I cook primarily with butter and organic coconut oil. I occasionally use olive oil, often with water, for steam cooking.

- Consumption of plenty of animal products, with emphasis on eating the animal whole. All cooked. This includes small fish (sardines and smelts) eaten whole about twice a week, and offal (usually beef liver) about once or twice a week. I also eat eggs, about 3-5 per day.

- Practice of moderate exercise (2-3 sessions a week) with a focus on resistance training and high-intensity interval training (e.g., sprints). Also becoming more active, which does not necessarily mean exercising but  doing things that involve physical motion of some kind (e.g., walking, climbing stairs, moving things around), to the tune of 1 hour or more every day.

- Adoption of more natural eating patterns; by eating more when I am hungry, usually on days I exercise, and less (including fasting) when I am not hungry. I estimate that this leads to a caloric surplus on days that I exercise, and a caloric deficit on days that I do not (without actually controlling caloric intake).

- A few minutes (15-20 min) of direct skin exposure to sunlight almost every day, when the sun is high, to get enough of the all-important vitamin D. This is pre-sunburn exposure, usually in my backyard. When traveling I try to find a place where people jog, and walk shirtless for 15-20 min.

- Stress management, including some meditation and power napping.

- Face-to-face social interaction, in addition to online interaction. Humans are social animals, and face-to-face social interaction contributes to promoting the right hormonal balance.

When I was fat, my appetite was a bit off. I was hungry at the wrong times, it seemed. Then slowly, after a few months eating essentially whole foods, my hunger seemed to start “acting normally”. That is, my hunger slowly fell into a pattern of increasing after physical exertion, and decreasing with rest. Protein and fat are satiating, but so seem to be fruits and vegetables. Never satiating for me were foods rich in refined carbohydrates and sugars – white bread, bagels, doughnuts, pasta etc.

Looking back, it almost seems too easy. Whole foods taste very good, especially if you are hungry.

But I will never want to each a peach after I have a doughnut. The peach will be tasteless!

Monday, July 19, 2010

Anti-Aging with Aubrey de Grey

A couple of weekends ago I was in LA going to a meet-up with biomedical gerontologist Aubrey de Grey to discuss new research on aging. He talked about a new paper he co-authored with a few of his other biogerontologist colleagues.

So, I asked him to tell me more. Out of that meeting came a follow-up interview and this article published on KurzweilAI.net. Please read that article as it describes well why we must prevent a "Global Aging Crisis".


And for anyone who wants to read the entire interview with Aubrey and the efforts of the SENS Foundation, here it is below:

Q. Would you give a brief summary of the new paper of which you are listed as a co-author in Science Translational Medicine?

The essence of this paper is that we argue for a more balanced approach to the quest for interventions to postpone age-related ill-health. Specifically, we highlight the fact that there are three general strategies to consider:

- promotion of healthy lifestyles (through reduction in environmental toxins, medical control of disease risk factors, etc);

- interventions to slow down the lifelong aging process, i.e. the accumulation of various types of molecular and cellular damage that eventually contribute to age-related pathology; and

- interventions to repair that damage using (broadly defined) regenerating medicine

and we highlight the features and limitations of each approach. Our main conclusion, as reflected in the paper's title, is that there is a atrong case for increasing the emphasis on the "damage-repair" style of intervention, which hitherto has received much less attention from gerontologists and policy-makers than the others.

Q. Who are the other authors on the review and why is it meaningful to have them come together with you to co-author this paper?

Five of the other authors - Butler, Campisi, Finch, Martin and Vijg - are among the absolute top tier of biogerontologists, whose views are universally respected within the field. They have never previously expressed the above conclusion (or not nerly so unequivocally), even individually. Therefore, their voice here will make a huge impact on thinking about this issue, both within the field and beyond. Another author, Gough, is a policy veteran with great influence in the corridors of power. The remaining authors - Rae, Perrott and Logan - are involved in organisations that have been promoting the case for repair-style interventions for some years.

Q. What impact will this paper have on the SENS Foundation? Do you expect the paper to raise more awareness and possible funding for research into "pre-disease interventions" and "human regenerative engineering"?

I feel very confident that this will be of great benefit to SENS Foundation, yes. SENSF is the global spearhead of the application of regenerative medicine to aging, and we intend to leverage this paper considerably.

Q. Could you briefly describe "pre-disease interventions" and "human regenerative engineering" as addressed in your paper?

We don't go into many details in this paper concerning the specifics of the interventions, but in my work over the past decade I have identified seven major categories of molecular and cellular "damage" that I believe we need to repair (or in some cases obviate) in order to rejuvenate the aged body comprehensively, and ways to implement that repair. Very briefly, the interventions consist of stem cell therapies to combat cell loss, suicide gene therapy against death-resistant cells, non-human enzymes against intracellular "molecular garbage", vaccination against extracellular "molecular garbage", small-molecule drugs against spontaneous crosslinks in the extracellular matrix, nuclear copies of the mitochondrial DNA to obviate mitochondrial mutations, and a complex combination therapy (involving suppression of telomere elongation together with a variety of stem cell therapies) to pre-empt cancer.

Q. Many gerontologists do not share your ideals about ending aging, how does the new paper seek to change paradigms? What paradigm is ideal in gerontology?

The ideal is not to have only one paradigm. Those gerontolgists who favour "optimising metabolism" to slow down the creation of these various types of molecular and cellular damage, rather than regenerative medicine to repair the damage, are not wrong: their approach is intrinsically less powerful, but it's also very likely to be far easier to implement. As such, it provides a "bridge" to the regenerative approach; the greatest benefit to humanity in terms of lives saved and suffering averted will occur if both approaches are pursued equally aggressively.

Q. What is human healthspan extension? How is this different than life extension?

For practical purposes there is no difference, and this is something that needs to be understood far better by the general public and by policy-makers. We simply cannot plausibly extend lifespans very much by keeping people alive in the diminished state of health that most people currently endure for the last year or three of their lives. Significant life extension will therefore occur only if we can postpone age-related ill-health, i.e. extend the healthy part of our lives. With regenerative medicine, I believe we have a realistic prospect of postponing ill-health so well that we simply never attain it - we postpone it faster than time is passing.

Q. Why do you think more people in general need to become familiar with new paradigms such as human healthspan extension? How will this new paper seek to break pre-conceived notions about aging?

The core reason is the obvious, boring one: funding. Serious public-purse resources to develop regenerative medicine against aging will emerge only when there is public support for it, and that will occur only by educating the respected, mainstream scientific community to take the concept seriously. This paper is directed mainly at those people - the biogerontologists who have hitherto presumed that this approach is too difficult to be worth even considering, or who have not appreciated its potential.

Q. What advice would you give to university students and scientists who are interested in performing research in line with goals for slowing or ending aging and human healthspan extension?

The main advice is simply to read up on the relevant experimental work that has already been done. Virtually all my conversations with scientists who initially doubt the feasibility of regenerative medicine against aging gravitate rapidly to the discovery that their pessimism arises from simply not knowing about the relevant published work. My book "Ending Aging" is a good place to start, since it is a single source for all this information with hundreds of references to the primary experimental literature.

Q. What projects is SENS working on? What lies ahead from the research?

SENS Foundation's research direction is based on two main principles: prioritise the SENS components that are not being adequately pursued through other funding sources, and prioritise those that are the most challenging. These two principles naturally overlap a lot, since difficulty is a disincentive to work on something. Accordingly, we are pursuing most of the seven SENS strands at this time. We anticipate that this will continue.

Q. How can more funding help SENS with their goals for the future?

There are no surprises there: it all about the fact that biology is irreducibly expensive. In particular, as more and more of our research programs move from the cell culture stage into live mice, the expense rises sharply.

Q. What can people look forward to in the near future from greater funding into aging research? What are a few concrete examples of near-future benefits?

I believe the main benefits we can expect to see in the coming few years will come from public health advances, and possibly from drugs to optimise metabolism. These will act, as I noted above, as a "bridge" to allow more people to survive in a healthy state for long enough to be able to benefit from the regenerative approach that SENS Foundation is pursuing.