Unfortunately, getting older comes with a common consequence affecting up to 16 percent of elderly people – gradual reduction in brain size, which is associated with problems in learning and memory. However, a new study reports that daily supplementation with high doses of B vitamins may help slow the rate of brain degeneration.
Oxford researchers gave 168 individuals over the age of 70 supplements containing high doses of folic acid (0.8 milligrams per day), B6 (20 milligrams per day) and B12 (0.5 milligrams per day), or a placebo as part of a randomized, double-blind controlled trial. Then, following two years of the supplementation program, the participants’ brains were assessed using serial volumetric magnetic resonance imaging scans.
The researchers reported their results in the September issue of PLoS One: the rate of brain shrinkage, or atrophy, in the group taking the supplements was 53 percent lower in comparison to the group taking the placebo. Their conclusion was that the high doses of B vitamins slowed the rate of brain shrinkage in elderly with mild cognitive impairment.
According to the authors, however, it is still unclear which vitamin provided the greatest benefit for the brain. They found that the reduced rate of brain atrophy was a result of an increase in either vitamin B12 status or folic acid status, but could not conclude which of the two “vitamins is the most important.”
They added that vitamin B6 may be less important for brain health since there was a, “lack of association of atrophy with the change in cystathione levels, a marker of vitamin B6 status.”
Folic acid and vitamin B12 play a role in protecting the brain, most likely because their presence helps to lower the concentration of the amino acid homocysteine in plasma. Higher levels of homocysteine are a risk factor associated with smaller brain size as well as problems with learning and memory — as well as related to poor heart and cardiovascular health.
The study adds to emerging evidence that supplementation with B vitamins may be a convenient way for elderly to help support memory and learning.
Source: Smith AD, Smith SM, de Jager CA et al. Homocysteine-lowering by B vitamins slows the rate of accelerated brain atrophy in mild cognitive impairment: a randomized controlled trial. PLoS One 2010;5:e12244.
Wednesday, September 29, 2010
Arts at the Heart feature on Big Society

To read Clive Parkinson's paper on Big Society, go to: http://www.nalgao.org/e107_images/custom/aahseptfinal1b.pdf
What are the different kinds of seizures
About 2.5 million people in North America have active epilepsy, leaving them susceptible to seizures. However, not all epileptic seizures are the same. They can range in intensity from non-serious to seriously life-threatening.
During a seizure, a person may lose a certain degree of consciousness, called impaired consciousness, and may also experience an episode of intense, widespread motor activity called a convulsion. A convulsion can occur without loss of consciousness, but not normally.
A seizure happens when the way the brain functions is somehow abnormal causing the impaired consciousness or convulsions. When they happen at the same time, you'd call them a convulsive or sensory seizure.
Epilepsy is diagnosed when brain disfunction is disturbed for a relative while or if someone is particularly prone to seizures. You have to have at least two seizures that are not caused by something else, like a disease, before the diagnosis is made.
Now, as for the different types:
- A partial seizure is one that is localized in a specific set of brain structures, where as a generalzied seizure involves widespread abnormal brain activity such as happening in the cerebral cortex of both brain hemispheres.
- A tonic-clonic seizures are the most common, and often called grand mal seizures. They are generalized convulsive seizures where one also loses consciousness. They occur in phases: The tonic phase is when there's a stiffening of muscles, then the clonic phase is when there's relaxation -- the result are muscle spasms of contraction/relaxation of muscles.
- A myoclonic seizure is when you have muscle twitching or limb jerking. It's generally due to problems with cortical activity in the brain. It's localized. But sometimes, myoclonic jerks can involve upper limbs or the entire body being thrown about.
Some nonepileptic seizures occur. They include those tonic-clonic seizures that happen after withdrawal from sedatives or hypnotic drugs. If the seizures come in a chain of patterns, then it's called status epilepticus. Other nonepileptic seizures can happen because of bacterial meningitis, renal or hepatic failure, hypoxic encephalopathy, fever, brain tumors or cerebrovascular accidents. Nonepileptic seizures are usually not a concern once underlying cause is treated.
On the other hand, epileptic seizures are primary from epilepsy. Their origins are in the gray matter of the brain, or, actually, the cortical tissue that forms the hippocampus, which is necessary for memory. The neurons in the cortex that give rise to excitatory outflow are the pyramidal cells, which are kind of pyramid shaped.
The pattern of a seizure is usually pretty predictable. It starts with a prodrome, or warning symptoms like a mental, motor or sensory phenomena called an aura, which a person might remember happened last time a seizure occurred. Then, the seizure happens and depends on type, as explained above.
A partial seizure will either have a focal motor without march, in which the seizure comes from neurons in the motor cortex that leads to twitching on the hand or a side of the face and doesn't spread across. Or, it may have a focal motor with march, which happens when the twitching spreads to the upper arm, shoulder and face. If the spread is limited, then it's called a simple partial seizure.
Complex partial seizures can result of a change in consciousness after a simple partial seizure, with resulting "automatisms," like lip smacking, sucking, chewing, fumbling, incoherent talking, etc, which have no apparent purpose. When these occur, it's highly possible they arise from the temporal lobe.
If the partial seizure progresses, it may end up becoming a generalized tonic-clonic seizure with a full episode including loss of consciousness.
A generalized seizure doesn't have any specific focus, so generally includes seizures that vary a lot. Absence seizures are a type of generalized seizure in that they involve an appearance of absence, like a blank stare for about two to ten seconds along with lip smacking, chewing, etc. A simple absence is common in childhood or adolescence epilepsy. An absence variant is associated with Lennox-Gastaut, which usually results from mental retardation in children.
The tonic-clonic, or grand mal seizures, are a maximal seizure response in the brain. It is generalized because it involves both hemispheres and is usually has a prodrome. The prodrome could be depression, irritability, sometimes euphoria (as Dostoyevsky expressed saying that seizures began with ecstasy). The seizure, again, has a tonic phase of about 10-20 seconds with muscle flexing, with sometimes an epileptic cry. Tthen a 1/2 to 2-minute clonic phase of relaxation. Then these phases are followed by a terminal phase for 5 minutes when the patient goes into something like a coma, going totally limp and quite.
Diagnosis involves an electroencephalograph, or EEG, as well as CT scans or magnetic resonance imaging (MRI) (which are more effective than CT scans). The EEG will determine characteristic interictal (period of time between seizures) abnormalities. A MRI could identify structural abnormalities in the cortex.
Medical treatment and seizure-coping strategies may involve pharmaceutical agents as well as simple stress-reduction techniques, plus routine EEGs and seizure monitoring with CT or MRI.
Reference
Nowak et al.
Tuesday, September 28, 2010
What are the differences between types of headaches
If there's one thing that will give you a headache, it's trying to remember all of the different kinds of headaches are, and what are their causes or what are they associated with, which can involve simply drinking too much, smoking, stress or fatigue to food poisoning, fever, carbon monoxide poisoning, hypothyroidism, and so on.
Basically, any headache is generated pain originating from structures in the head such as the venous sinuses, the tributary veins, the dura at the base of the brain, the arteries within the meninges, or the subarachnoid space. These are all sensitive to stimulation and cause pain. Plus, there are trigeminal, vagus, and upper cervical nerves that can cause pain if under tension, inflamed or compressed.
Tension headaches are the most common. They're also very poorly understood and not treated very effectively. They happen just from fatigue, stress, worry. Usually they go away with stress-reduction techniques and relaxation, antidepressants or antianxiety drugs. They can last for a night, for a week, or even for years. It usually feels kind of like you have a gradual increase in nonthrobbing pressure or tightness in the head, which varies in intensity.
Migraines are a different story. For one thing, it's localized to one side of your head, like behind an eye or ear, and can result in throbbing-to dull pain and nausea or vomiting. Usually, children and young adults get them, as well as women beginning a premenstrual part of their cycles. A migraine is thought to happen due to arteriolar constriction and decreased blood flow in the head.
A classic migraine will have some typical foreboding with cravings, drowsiness or depression, and include light sensitivity or bright zigzag lines. The migraine usually lasts about 20 to 30 minutes.
A complicated migraine, or neurological migraine, involves symptoms similar to classic migraine, but with neurological symptoms. The extras include lip, face, hand and leg tingling as well as weakness or paralysis (like a stroke). There may be problems with a person's speech. It can last minutes or hours.
Cluster headaches can be difficult to treat. They are like migraines, but happen usually two or three hours after falling asleep. The person wakes up with steady, intense pain in an orbit and with flowing tears and one stuffed nostril that runs later on in the day. He or she will also probably have a constricted eye pupil, a drooped eyelid and a flushed cheek on the same side. The whole episode can last 10 minutes to 2 hours. Treatment can include antidepressants or corticosteroids. It's often called the "suicide headache" because of its intensity.
Reference
Nowak et al.
Income, obesity, and heart disease in US states
The figure below combines data on median income by state (bottom-left and top-right), as well as a plot of heart disease death rates against percentage of population with body mass index (BMI) greater than 30 percent. The data are recent, and have been provided by CNN.com and creativeclass.com, respectively.

Heart disease deaths and obesity are strongly associated with each other, and both are inversely associated with median income. US states with lower median income tend to have generally higher rates of obesity and heart disease deaths.
The reasons are probably many, complex, and closely interconnected. Low income is usually associated with high rates of stress, depression, smoking, alcoholism, and poor nutrition. Compounding the problem, these are normally associated with consumption of cheap, addictive, highly refined foods.
Interestingly, this is primarily an urban phenomenon. If you were to use hunter-gatherers as your data sources, you would probably see the opposite relationship. For example, non-westernized hunter-gatherers have no income (at least not in the “normal” sense), but typically have a lower incidence of obesity and heart disease than mildly westernized ones. The latter have some income.
Tragically, the first few generations of fully westernized hunter-gatherers usually find themselves in the worst possible spot.
Monday, September 27, 2010
High doses of B vitamins may slow brain shrinkage and support memory
Unfortunately, getting older comes with a common consequence affecting up to 16 percent of elderly people – gradual reduction in brain size, which is associated with problems in learning and memory. However, a new study reports that daily supplementation with high doses of B vitamins may help slow the rate of brain degeneration.
Oxford researchers gave 168 individuals over the age of 70 supplements containing high doses of folic acid (0.8 milligrams per day), B6 (20 milligrams per day) and B12 (0.5 milligrams per day), or a placebo as part of a randomized, double-blind controlled trial. Then, following two years of the supplementation program, the participants’ brains were assessed using serial volumetric magnetic resonance imaging scans.
The researchers reported their results in the September issue of PLoS One: the rate of brain shrinkage, or atrophy, in the group taking the supplements was 53 percent lower in comparison to the group taking the placebo. Their conclusion was that the high doses of B vitamins slowed the rate of brain shrinkage in elderly with mild cognitive impairment.
According to the authors, however, it is still unclear which vitamin provided the greatest benefit for the brain. They found that the reduced rate of brain atrophy was a result of an increase in either vitamin B12 status or folic acid status, but could not conclude which of the two “vitamins is the most important.”
They added that vitamin B6 may be less important for brain health since there was a, “lack of association of atrophy with the change in cystathione levels, a marker of vitamin B6 status.”
Folic acid and vitamin B12 play a role in protecting the brain, most likely because their presence helps to lower the concentration of the amino acid homocysteine in plasma. Higher levels of homocysteine are a risk factor associated with smaller brain size as well as problems with learning and memory — as well as related to poor heart and cardiovascular health.
The study adds to emerging evidence that supplementation with B vitamins may be a convenient way for elderly to help support memory and learning.
Source: Smith AD, Smith SM, de Jager CA et al. Homocysteine-lowering by B vitamins slows the rate of accelerated brain atrophy in mild cognitive impairment: a randomized controlled trial. PLoS One 2010;5:e12244.
RAMBERT DANCE: AWAKENINGS

Much of the arts and health movement is concerned with the instrumental impact of the arts, with organisations like Arts for Health striving to engage marginalised communities in creative and cultural activity that might impact on well-being. There is ample evidence that illustrates engaging in the arts not only improves physical and mental health, but the very act of bringing people together provides something of the civic glue to healthy communities.
The implicit impact of the arts in relation to health and well-being however, is harder to define. Many interesting studies illustrate that the theatre and gallery-going public are more likely to be the educated middle-classes, and that people marginalised by issues such as mental ill-health are far less likely to participate in cultural opportunities because of broad ranging social and economic barriers.
For someone with limited experience of contemporary dance, an invitation to the Lowry to watch a new piece of dance being premiered could have made for a challenging evening. The Lowry was full to capacity for this premiere of Rambert Dance Company’s interpretation of the work of Dr Oliver Sacks, Awakenings, already made famous by the Hollywood film of the same name,
As its stimulus, Awakenings, uses the true story of a group of patients affected by sleeping sickness following the 1918 flu pandemic. Through the prescription of the drug L-Dopa, the patients who had been in a catatonic state for decades become suddenly animated, but the drug’s effects are short lived and this brief period of lucidity is marred by seizures and delirium, with patients ultimately slipping back into a twilight world.
This performance visually and physically captures the passage of treatment, from the liberation of symptoms to the subsequent relapse of the patients. For the audience and dancers, the music replaces the drug L-Dopa and offers us the opportunity to connect viscerally to the isolated and disjointed worlds of the individuals affected by this strange sleeping sickness.
The unpredictability of the tics and twitches of this condition were made manifest by the dancers as they entered, walking backwards onto the stage, as if wary and watchful of their condition. Suddenly, we would see their bodies contract in spasm, accompanied by spikes of music. In contrast were the darker moments, when a percussive thrum reflected the depressive slump of the patients; the dancer’s bodies heavy with the burden of this illness.
There was a real sense of tension in the audience, watching people dressed as if for work on a summer’s day on Madison Avenue, literally frozen in their tracks, as they made their way to or from their destination. We had the impression that they were locked into a world entirely within them-selves and that all they could do was to observe the effects of the condition as it took over them.
On the empty stage, the elegantly dressed and beautifully lithe performers made visible something of the internal landscape of the patients they inhabited. But what relevance to this arts and health agenda is there?
Having worked with a wide range of communities who believe that the ‘high-arts’ have nothing to do with them, I’m aware that dance or ballet is often dismissed as inaccessible to people who haven’t experienced it. I am often looking for ways to describe disease, illness or concepts of well-being and frequently words are insufficient. What I crave are universal metaphors that reach out beyond the confines of language or cultural experience and beyond the common assumptions that status is a barrier to appreciating subtle or complex ideas.
It would be easy to argue that Awakenings was very unambiguous and without a need for tricky interpretation or you may share my view, that this visceral manifestation of what it is to be human and to have free will, only for that free will be taken away, makes both fluid and solid the potential and frustration that our fleeting experience of life offers.
It would be easy to argue that Awakenings was very unambiguous and without a need for tricky interpretation or you may share my view, that this visceral manifestation of what it is to be human and to have free will, only for that free will be taken away, makes both fluid and solid the potential and frustration that our fleeting experience of life offers.
Sunday, September 26, 2010
Ketones and the Atkins diet
The way the Atkins Diet or any low-carb diet for weight loss works is by limiting the presence of glucose so as to encourage fatty acids to be converted by the liver into ketone bodies.
When ketone bodies accumulate in the blood, they lower the pH of the blood. This is a state called ketosis, which is basically when glucose use for energy is slowed down and fatty acid use for energy is sped up. If too many ketone bodies build up, however, then hyperketonemia results and possibly dangerous ketoacidosis.
After a good night's sleep, it's known that the fasting state will increase amount of ketone bodies a little, because of depleted glycogen stores. But after 2 days ketone bodies can rise 140-fold.
In early starvation, the muscle will use ketone bodies, but then changes to use of fatty acids so that the ketone bodies can be used for the brain. Prolonged starvation causes ketones to become the dominant fuel for the brain, to spare amino acids and loss of muscle.
The dramatic rise of use of fatty acids in ketosis will lead to dramatic weight loss as demonstrated by the Atkins diet. Plus, the satiety resulting from eating high contents of fat and protein may also reduce food intake overall.
But as shown recently, the Atkins diet or a diet high in animal foods, may result in increased risk of all-cause mortality. So, try eco-Atkins?
The four reactions of beta-oxidation
Fatty acid oxidation is dependent on entry of fatty acids into the mitochondria, which provides substrate for beta-oxidation in the mitochondrial matrix. The fatty acids are transported in as acylcarnitines.
Step 1 in beta-oxidation happens when a fatty acyl CoA that's made at the inner surface of the inner mitochondrial membraine is oxidized by acyl-CoA dehydrogenase. The flavoprotein enzyme uses FAD to accept an electron to complete the reaction. The products end up being trans-enoyl CoA and FADH2, which transfers electrons into the oxidative phosphorylation pathway to recreate FAD.
Step 2 in beta-oxidation is hydration of trans-enoyl CoA producing 3-L-hydroxyacyl CoA.
Step 3 is when 3-L-hydroxyacyl CoA is oxidized to 3-ketoacyl-CoA intermediate and generates NADH.
Step 4 occurs when beta-ketoacyl-CoA thiolase cleaves the 3-ketoacyl-CoA to produce a 2-carbon atom short fatty acyl-CoA and acetylCoA.
Acetyl CoA is then ready to enter in the TCA cycle for ATP energy production, and FADH2 and NADH will also be reoxidzed in the ETS to produce ATP energy.
Reference
Devlin...
Saturday, September 25, 2010
What are phytates and how do they affect absorption of minerals?
You've heard that spinach has a lot of iron, right? But what you may not know is that spinach is a poor way to get iron because of its content of phytate.
Some of the iron in spinach is bound to phytate. Most of the iron you get is absorbed in the small intestine's duodenum. It comes into the mucosal cell as either a free ion or as heme. If iron is attached to phytates, however, its resistant to disassociation in the gut.
One way to help improve the absorption is by cooking the spinach to break down ligands attached to the iron. And by combining protein with your spinach, you can cause the stomach to release more hydrochloric acid, lowering the pH and helping free up some more iron.
When people have stomach problems that inhibit their ability to release hydrochloric acid (such as when people become older), it's known that a lot of iron is not absorbed at all. In these cases, it may be important to increase the amount of iron in the diet (specifically heme iron from animal foods since its easiest to absorb), even supplement with iron.
Wednesday, September 22, 2010
Low nonexercise activity thermogenesis: Uncooperative genes or comfy furniture?
The degree of nonexercise activity thermogenesis (NEAT) seems to a major factor influencing the amount of fat gained or lost by an individual. It also seems to be strongly influenced by genetics, because NEAT is largely due to involuntary activities like fidgeting.
But why should this be?
The degree to which different individuals will develop diseases of civilization in response to consumption of refined carbohydrate-rich foods can also be seen as influenced by genetics. After all, there are many people who eat those foods and are thin and healthy, and that appears to be in part a family trait. But whether we consume those products or not is largely within our control.
So, it is quite possible that NEAT is influenced by genetics, but the fact that NEAT is low in so many people should be a red flag. In the same way that the fact that so many people who eat refined carbohydrate-rich foods are obese should be a red flag. Moreover, modern isolated hunter-gatherers tend to have low levels of body fat. Given the importance of NEAT for body fat regulation, it is not unreasonable to assume that NEAT is elevated in hunter-gatherers, compared to modern urbanites. Hunter-gatherers live more like our Paleolithic ancestors than modern urbanites.
True genetic diseases, caused by recent harmful mutations, are usually rare. If low NEAT were truly a genetic “disease”, those with low NEAT should be a small minority. That is not the case. It is more likely that the low NEAT that we see in modern urbanites is due to a maladaptation of our Stone Age body to modern life, in the same way that our Stone Age body is maladapted to the consumption of foods rich in refined grains and seeds.
What could have increased NEAT among our Paleolithic ancestors, and among modern isolated hunter-gatherers?
One thing that comes to mind is lack of comfortable furniture, particularly comfortable chairs (photo below from: prlog.org). It is quite possible that our Paleolithic ancestors invented some rudimentary forms of furniture, but they would have been much less comfortable than modern furniture used in most offices and homes. The padding of comfy office chairs is not very easy to replicate with stones, leaves, wood, or even animal hides. You need engineering to design it; you need industry to produce that kind of thing.

I have been doing a little experiment with myself, where I do things that force me to sit tall and stand while working in my office, instead of sitting back and “relaxing”. Things like putting a pillow on the chair so that I cannot rest my back on it, or placing my computer on an elevated surface so that I am forced to work while standing up. I tend to move a lot more when I do those things, and the movement is largely involuntary. These are small but constant movements, a bit like fidgeting. (It would be interesting to tape myself and actually quantify the amount of movement.)
It seems that one can induce an increase in NEAT, which is largely due to involuntary activities, by doing some voluntary things like placing a pillow on a chair or working while standing up.
Is it possible that the unnaturalness of comfy furniture, and particularly of comfy chairs, is contributing (together with other factors) to not only making us fat but also having low-back problems?
Both obesity and low-back problems are widespread among modern urbanites. Yet, from an evolutionary perspective, they should not be. They likely impaired survival success among our ancestors, and thus impaired their reproductive success. Evolution “gets angry” at these things; over time it wipes them out. In my reading of studies of hunter-gatherers, I don’t recall a single instance in which obesity and low-back problems were described as being widespread.
We’ve heard a lot about Big Society over the last few months, but what does it mean for the Arts/Health agenda in the North West?
We’re planning an event at Manchester Metropolitan University on the 29th October 2010.
This will follow on from last years North West Frontier, where health professionals, artists and other actors from the field fed into the start of a regional/sub-regional conversation around inequalities, the arts, health and well-being.
Aspirations from this event included; networking opportunities; access to wider networks and knowledge; training and advocacy.
We also discussed a strategic framework for the region, but with government changes, ongoing structural changes across all sectors and now vicious cuts, creating another strategy seems a futile exercise.
Following feedback from the networking sessions and dialogue across the region, what we’d be interested in doing is spending time together and creatively pulling together a Manifesto for Arts/Health across the region.
So this isn’t necessarily about frameworks, bullet-points and strategy; but it will be a statement about shared vision, passion, commitment and possibility that we and key allies can sign up to.
If you want to take part, places will be very limited and details will be forthcoming, but for now email artsforhealth@mmu.ac.uk to express your interest in taking part.
Monday, September 20, 2010
What’s the difference between systemic, essential and secondary hypertension?
Our arteries are origins of potential disease and death. Most of arterial disease happens through sclerosis, or a hardening of the arteries. Previously we called this arteriocleoris, but that’s too general. So now, sclerosis is defined as either medial calcific sclerosis, hypertensive vascular disease or atherosclerosis.
Hypertensive vascular disease, in particular, is also called arteriosclerosis because it involves arteriole’s intima and media thickening as a result of cumulative amounts of plasma proteins,plus overproduction of basement membrane and extracellular matrix.
Systemic hypertension, or high blood pressure, is associated with hypertensive vascular disease and is a problem that is widespread. The term systemic distinguishes the condition from a local high blood pressure as in pulmonary (lung) or portal hypertension (hepatic portal system). The chief risk factors are genetics, race, older age, smoking, obesity and stress.
Essential hypertension does not usually have an identifiable cause, but is just a defect in mechanisms that control blood pressure. It may involve a defect in the kidney’s ability to excrete sodium, a defect in the arteriolar smooth muscle, or a defect causing exaggerated response of autonomic system.
Secondary hypertension results as a secondary aspect from a disorder such as kidney damage that causes elevated blood pressure.
The consequences of hypertension are both arteriolosclerosis (reduced arteriole’s lumen) and possible stroke or heart attack.
Reference
Nowak TJ, Hanfod AG. Pathophysiology: Concepts and applications for health care professionals, 3rd ed. 2004. New York, McGraw-Hill.
Saturday, September 18, 2010
Thrombosis and thromboembolism
When there’s a problem in normal blood flow, we call it a hemodynamic disorder. They are caused when there’s an overcoagulation of blood forming a thrombus in side a vessel. The process is called thrombosis, which can also result in embolism or infarction.
When a thrombus forms, it’s made up of platelets, erythrocytes, leukocytes and fibrin. It doesn’t form outside a blood vessel as clots do, but instead forms at a blood vessel wall. The thrombosis begins at a point attached to the vascular wall where platelets group together.
A coagulation cascade is triggered, but there’s no threatened blood loss. How does this happen? Endothelial damage, altered blood flow, or a state of blood hyper coagulation.
Endothelial damage can result from hemodynamic stress as blood flow under pressure causes arteries to expand and elongate. The pressure can be produced due to hypertension, a major cause.
But a second major cause is atherosclerosis.
Abnormal blood flow can cause more platelet contact with endothelium, which reduces rate of flow or stops it completely. The change can produce risk of adherence causing thrombosis.
Blood hypercoagulation is a situation when blood is highly susceptible to coagulation despite whether or not there is endothelial damage. It can occur when malfunction in systems, which may be due to immune system problems or liver overproduction of clotting factors.
Older people may have a deficiency of a coagulation inhibitor. Smokers and obese people may have hypercoagulation problems, but the mechanisms are not well understood.
Thrombosis ultimately results in a sequela of either resolution, organization, propogation, infarction or embolism.
Resolution is when the anticoagulation system is seeking to overcome the problem and is least threatening.
Organization happens when phagocytic digestion of a thrombus occurs about two or three days after the thrombus forms. An endothelium forms over the organizing tissue and the thrombus simply becomes part of the vascular wall. While this happens small channels sometimes are created for blood to pass through the thrombus through a process called recanalization.
Propagation is when a thrombus enlarges going along a vessel (a vein usually) and a red cap is produced along the vein’s lumen.
Infarction is when ischemia (when lumen is completely blocked by the thrombus) produces necrosis of a region. This is the most serious in arteries since they supply oxygen and nutrients.
Embolism is when a blood vessel is occluded by an embolus, when a mass of some sort is going along in the blood stream, which is usually result of a thrombus breaking away (as in thromboembolus).
Anticoagulatns, like heparin, are commonly used as therapy to avoid thromboembolism .
Reference
Nowak TJ, Hanfod AG. Pathophysiology: Concepts and applications for health care professionals, 3rd ed. 2004. New York, McGraw-Hill.
Blood: Circulating Life
Blood is a fluid that is made up of plasma and elements, which includes erythrocytes, leukocytes and platelets. At times the plasma volume and concentration can be affected as in fluid and electrolyte imbalances, but other times blood coagulation can have its disorders.
When elements are produced in the blood, we call this hemopoiesis. Hemopoiesis takes place through mitosis and differentiation of daughter cells. The cells specialize to produce a specific function. Most of the hemopoiesis happens in red bone marrow (about 2 liters of red marrow is in an adult’s skeleton). Formed element has very little reproductive abilities.
Stem cells are able to differentiate into all hemopoietic cells, or even form new stem cells. Progenitor cells are derived from stem cells but can’t self-renew themselves, so are said to be commited to a cell line.
Erythropoises, red blood cell formation, happens through mitosis. Then hemoglobin synthesis happens, followed by loss of organelles. The reticulocyte is finally a mature erythrocyte once cytoplasmic RNA is lost. It lasts about 120 days before removal in spleen, liver or marrow. Twenty five billion are lost every day, so production is about just as high.
Leukopoiesis happens in granulocytes and moncytes, with migration of lymphocyte progenitors to lymphoid tissue. We have about 7 million of these white blood cells in each milliliter of blood.
Thrombopoiesis produces thrombocytes, or platelets, from marro megakaryocytes. It happens through fragmentation as cytoplasm fragments are shedded from the megakaryocyte. There’s about 250 million platelets per milliliter.
Coagulation
Coagulation of blood is a response that occurs to block blood loss and basically is a turning of fluid blood to a gel so it stops flowing. The gel is a blood clot. It’s created with long protein filaments that become a tangled mesh next to wherever damage happened. The filaments are made of fibrin, derived from fibrinogen, which is split by thrombin, an enzyme derived from prothrombin. The thrombin also activates factor XIII to create crosslinking of fibrin filaments.
Prothrombin is activated to produce thrombin by a cascade of events that are a result of clotting factors. The clotting factors hang out in the plasma, but are only activated when endothelial cells or fibroblasts at a damaged sites have membrane changes that spills out tissue factor, or tissue thromboplastin.
Tissue factor activates the extrinsic pathway, clotting factors activate, and fibrin starts coagulation. The thrombin also stimulates another cascade called intrinsic pathway, which triggers even larger amounts of fibrin production.
Calcium is required for coagulation but only a little bit so a calcium deficiency is unlikely to affect response. The calcium is taken up by chelating agents . The liver contributes fibrinogen, prothrombin and clotting factors in a way that requires vitamin K.
Bleeding Disorders
A bleeding disorder can occur when there are issues with platelet or clotting factors. Thrombocytopenia is a condition that occurs when there aren’t enough platelets.
Clotting factor disorders can include Von Willebrand’s disease when a factor interferes with platelet binding or hemophilia when there are deficiencies in clotting factors.
Impaired hepatic synthes occurs when liver cannot produce enough clotting factors such as due to deficiency of vitamin K or if liver damage causes abnormal clotting factors to be produced.
Sometimes bleeding disorders can occur from small blood vessels as in vascular purpura, which is a blood vessel abnormality.
Erythrocyte disorders
When there are too many erythrocytes, we have polycythemia; and when there are too few, we have anemia.
Anemia can happen due to little oxygen transport, iron deficiency, B12 deficiency, folic acid deficiency, or due to hemolysis because of abnormal blood cells (sickle cell, thalassemia).
Polycythemia can involve overproduction of red blood cells in the marrow. Smokers can suffer secondary polycythemia when inhaling carbon monoxide because it binds to hemoglobin causing compromised oxygen delivery, which can trigger increased erythrocyte production.
Leukocyte disorders
Like in erythrocytes, there may be too many leukocytes (leukocytosis) or too few (leukopenia).
Leukopenia usually happens because of neutropenia, when white cells are depleted because of infection or not enough production from marrow because of anti-tumor drugs or radiation.
Leukocytosis happens when there’s increased demand to a inflammation.
Leukemia is a cancer that results when a leukocyte precursor turns into a malignant tumor, then spill to the blood.
Reference
Nowak TJ, Hanfod AG. Pathophysiology: Concepts and applications for health care professionals, 3rd ed. 2004. New York, McGraw-Hill.
Friday, September 17, 2010
Growth of Tumors
When an overgrowth of tissue forms into neoplastic mass, it’s called a neoplasm or tumor. Neoplasia can have a deadly outcome such as in cancer. It is the No. 2 killer in North America with 30 percent suffering from the disease. A quarter of North American adults die of cancer. It also kills more children than any other disease.
Oncology is the study of tumors and when we talk about tumors, there’s two important characteristics – pattern of growth and tissue of origin. A tumor is benign if growth is slow, orderly and the tumor is localized. It’s malignant if the growth is rapid, disorderly and invades other normal tissues. Cancer is result of a malignant tumor that spreads to distant points in the body.
We add the suffix “-oma” when designating a benign tumor and what in which tissue it originates. An osteoma is a benign tumor in bone. A fibroma is a benign tumor in fibrous tissue.
If a malignant tumor arises, then it is named depending on which embryonic tissue it originates from. If from the ectoderm or dndoderm, then it’s a carcinoma (usually skin and epithelial linings). If it’s a glandular tumor, then it’s called an adenocarcinoma. If it occurs in the mesoderm, then it’s a sarcoma such as a chondrosarcoma or fibrosarcoma.
Then, there are exceptions, such as melanoma, lymphoma, and hepatoma which sound benign but are actually malignant. Malignant tumors in leukocyte-producing tissues are myeloid leukemia (red bone marrow) and lymphcytic leukemia (lymphoid tissue).
A benign tumor’s cells are about normal size and shape and pretty much looks like normal tissue, but a malignant tumor is very pleomorphic, enlarged and contains abnormal nuclei and chromosome structures. Sometimes the cells are huge because they fail to undergo mitosis.
Benign tumors grow faster than normal, but are slower than malignant tumors. They also have a fibrous connective tissue capsule surrounding the mass, which creates a distinct line to separate it from normal tissue. Generally, the slow growth causes less damage and surgical removal leads to a pretty good prognosis.
Malignant tumors grow quickly and are aggressive in their invasion. They send whole columns of cells to disrupt other normal tissues. They rarely come within a capsule as the benign tumors do. The line is blurred between malignant tumor tissue and normal tissue. Metastasis is a major factor causing a poor prognosis as growth at primary sites usually lead to establishment of tumors in secondary sites.
A spread of malignant tumor to secondary sites increases damaging effects. The metastasis of tumor cells often are carried by blood or lymph. If the invasion of a vein or lymphatic vessel occurs, then an emboli is formed that is used to gain access to a secondary site. Capillaries and lymphatic vessels are easily invaded, especially by carcinomas.
Metastasis can also involve spreading through body cavities. These can include adenocarcinomas shedding from the pancreas into the pelvic cavity or when a neuroblastoma from a the medulla oblongata spreads to the subarachnoid space invading the spinal canal.
Iatrogenic metastasis is rare. It occurs when medical intervention introduces tumor tissue to a site to develop into a secondary tumor.
Tumors growth at primary and secondary sites impairs normal functions. Malignant tumors cause continual increased damage, which generally overwhelm the body despite therapy.
Reference
Nowak TJ, Hanfod AG. Pathophysiology: Concepts and applications for health care professionals, 3rd ed. 2004. New York, McGraw-Hill.
Green tea could lead to longer life by protecting DNA
Last year, scientists from The Chinese University of Hong Kong found a positive association between high consumption of tea (Camellia sinensis) and longer telomere length – a marker of younger “biological age” – and living an average of five years longer, but it was unclear just how much of an impact was made by the tea.
Now scientists from Hong Kong Polytechnic University have discovered, through a cell culture study then followed by a controlled trial of supplementation in humans, that drinking two cups of green tea daily may offer notable DNA protection from oxidation.
Writing in the September issue of British Journal of Nutrition, the study’s authors state that the “genoprotective effects of green tea lend support to its use as a functional food and provide scientific evidence for the more confident recommendation of regular intake of green tea for health promotion.”
In the in vitro trial, the scientists prepared an infusion of tea that was used to treat human immune cells. The cells were then immediately exposed to hydrogen peroxide, a highly reactive oxidant, which showed a significant decrease in DNA damage.
In the single-blinded, crossover trial, 18 healthy, nonsmoking adults (ages 35 to 50) drank two cups (150 mL) of either freshly prepared green tea (Longjing or screw-shaped) or hot water (as a control) daily. All subjects randomly received their tea or water for four weeks, then had six weeks of washout period before starting on the next four weeks of tea or water.
The researchers collected blood samples and tested cells before and after supplementation when exposed to hydrogen peroxide. Tea drinkers had a 30 to 35 percent decrease in DNA damage.
Despite antioxidant content of green tea, the authors write that this study found no evidence of whole-body oxidative stress reduction in humans as measured by a urine biomarker. However, the study helps establish that drinking green tea delivers a targeted “antioxidant” action protecting cells against oxidation.
Green tea’s protective effects are thought to be dependent on its content of antioxidant polyphenols, which include its main polyphenol, epigallocatechin gallate (EGCG). Numerous studies in animals and humans have linked EGCG to positive health outcomes including better weight management, cellular health, heart health, and even longer life. This particular study did not investigate benefits of supplementation with EGCG as a green tea extract or benefits beyond protection of cell DNA.
Sources:
Chan R, Woo J, Suen E, Leung J, Tang N. Chinese tea consumption is associated with longer telomere length in elderly Chinese men. Br J Nutr. 2010 Jan;103(1):107-13. Epub 2009 Aug 12.
Han KC, Wong WC, Benzie IF. Br J Nutr. 2010 Sep 1:1-8. Genoprotective effects of green tea (Camellia sinensis) in human subjects: results of a controlled supplementation trial.
Strong causation can exist without any correlation: The strange case of the chain smokers, and a note about diet
Researchers like to study samples of data and look for associations between variables. Often those associations are represented in the form of correlation coefficients, which go from -1 to 1. Another popular measure of association is the path coefficient, which usually has a narrower range of variation. What many researchers seem to forget is that the associations they find depend heavily on the sample they are looking at, and on the ranges of variation of the variables being analyzed.
A forgotten warning: Causation without correlation
Often those who conduct multivariate statistical analyses on data are unaware of certain limitations. Many times this is due to lack of familiarity with statistical tests. One warning we do see a lot though is: Correlation does not imply causation. This is, of course, absolutely true. If you take my weight from 1 to 20 years of age, and the price of gasoline in the US during that period, you will find that they are highly correlated. But common sense tells me that there is no causation whatsoever between these two variables.
So correlation does not imply causation alright, but there is another warning that is rarely seen: There can be strong causation without any correlation. Of course this can lead to even more bizarre conclusions than the “correlation does not imply causation” problem. If there is strong causation between variables B and Y, and it is not showing as a correlation, another variable A may “jump in” and “steal” that “unused correlation”; so to speak.
The chain smokers “study”
To illustrate this point, let us consider the following fictitious case, a study of “100 cities”. The study focuses on the effect of smoking and genes on lung cancer mortality. Smoking significantly increases the chances of dying from lung cancer; it is a very strong causative factor. Here are a few more details. Between 35 and 40 percent of the population are chain smokers. And there is a genotype (a set of genes), found in a small percentage of the population (around 7 percent), which is protective against lung cancer. All of those who are chain smokers die from lung cancer unless they die from other causes (e.g., accidents). Dying from other causes is a lot more common among those who have the protective genotype.
(I created this fictitious data with these associations in mind, using equations. I also added uncorrelated error into the equations, to make the data look a bit more realistic. For example, random deaths occurring early in life would reduce slightly any numeric association between chain smoking and cancer deaths in the sample of 100 cities.)
The table below shows part of the data, and gives an idea of the distribution of percentage of smokers (Smokers), percentage with the protective genotype (Pgenotype), and percentage of lung cancer deaths (MLCancer). (Click on it to enlarge. Use the "CRTL" and "+" keys to zoom in, and CRTL" and "-" to zoom out.) Each row corresponds to a city. The rest of the data, up to row 100, has a similar distribution.
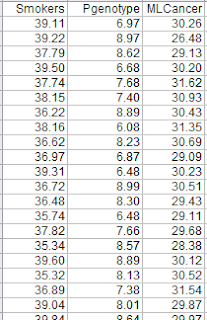
The graphs below show the distribution of lung cancer deaths against: (a) the percentage of smokers, at the top; and (b) the percentage with the protective genotype, at the bottom. Correlations are shown at the top of each graph. (They can vary from -1 to 1. The closer they are to -1 or 1, the stronger is the association, negative or positive, between the variables.) The correlation between lung cancer deaths and percentage of smokers is slightly negative and statistically insignificant (-0.087). The correlation between lung cancer deaths and percentage with the protective genotype is negative, strong, and statistically significant (-0.613).

Even though smoking significantly increases the chances of dying from lung cancer, the correlations tell us otherwise. The correlations tell us that lung cancer does not seem to cause lung cancer deaths, and that having the protective genotype seems to significantly decrease cancer deaths. Why?
If there is no variation, there is no correlation
The reason is that the “researchers” collected data only about chain smokers. That is, the variable “Smokers” includes only chain smokers. If this was not a fictitious case, focusing the study on chain smokers could be seen as a clever strategy employed by researchers funded by tobacco companies. The researchers could say something like this: “We focused our analysis on those most likely to develop lung cancer.” Or, this could have been the result of plain stupidity when designing the research project.
By restricting their study to chain smokers the researchers dramatically reduced the variability in one particular variable: the extent to which the study participants smoked. Without variation, there can be no correlation. No matter what statistical test or software is used, no significant association will be found between lung cancer deaths and percentage of smokers based on this dataset. No matter what statistical test or software is used, a significant and strong association will be found between lung cancer deaths and percentage with the protective genotype.
Of course, this could lead to a very misleading conclusion. Smoking does not cause lung cancer; the real cause is genetic.
A note about diet
Consider the analogy between smoking and consumption of a particular food, and you will probably see what this means for the analysis of observational data regarding dietary choices and disease. This applies to almost any observational study, including the China Study. (Studies employing experimental control manipulations would presumably ensure enough variation in the variables studied.) In the China Study, data from dozens of counties were collected. One may find a significant association between consumption of food A and disease Y.
There may be a much stronger association between food B and disease Y, but that association may not show up in statistical analyses at all, simply because there is little variation in the data regarding consumption of food B. For example, all those sampled may have eaten food B; about the same amount. Or none. Or somewhere in between, within a rather small range of variation.
Statistical illiteracy, bad choices, and taxation
Statistics is a “necessary evil”. It is useful to go from small samples to large ones when we study any possible causal association. By doing so, one can find out whether an observed effect really applies to a larger percentage of the population, or is actually restricted to a small group of individuals. The problem is that we humans are very bad at inferring actual associations from simply looking at large tables with numbers. We need statistical tests for that.
However, ignorance about basic statistical phenomena, such as the one described here, can be costly. A group of people may eliminate food A from their diet based on coefficients of association resulting from what seem to be very clever analyses, replacing it with food B. The problem is that food B may be equally harmful, or even more harmful. And, that effect may not show up on statistical analyses unless they have enough variation in the consumption of food B.
Readers of this blog may wonder why we explicitly use terms like “suggests” when we refer to a relationship that is suggested by a significant coefficient of association (e.g., a linear correlation). This is why, among other reasons.
One does not have to be a mathematician to understand basic statistical concepts. And doing so can be very helpful in one’s life in general, not only in diet and lifestyle decisions. Even in simple choices, such as what to be on. We are always betting on something. For example, any investment is essentially a bet. Some outcomes are much more probable than others.
Once I had an interesting conversation with a high-level officer of a state government. I was part of a consulting team working on an information technology project. We were talking about the state lottery, which was a big source of revenue for the state, comparing it with state taxes. He told me something to this effect:
Our lottery is essentially a tax on the statistically illiterate.
Thursday, September 16, 2010
How the healing process really happens
Healing is a pretty fascinating process that our body is capable of producing all on its own in response to destroyed tissue. The process replaces lost tissue and restores structure, strength and function. It’s intertwined with inflammation and so there’s overlap between the responses as you’ll note after reading these posts and previous ones.
It all happens when tissue that is undamaged next to the damaged tissue begins to proliferate. Functional cells called parenchyma combine to form a stroma. Then, there’s two different ways healing takes place: regeneration or repair. Regeneration is when tissue is replaced. Repair is when fibrous car tissue is used to fill gaps.
Basically, reestablishing epithelium at damaged spots come with four components:
- Regeneration: This is when cells lost are replaced by mitosis by adjacent parenchymal cells. It’s ideal because new tissue is ideal for normal function.
- Repair: This is when fibrous connective tissue, or a scar (made of strong collagen) is used to restore structure, but can’t regenerate. Fibroblasts are up to the task of creating fibrosis since they tend to resist damage from injury.
- Revascularization: Despite whether or not regeneration or repair has happened at the site of injury, revascularization, or angiogenesis, restores blood supply. It is the process of production of new blood vessels coming to the site to supply nutrients.
- Surface restoration: When mitosis is happening at a site of injury, the new cells migrate to the edge and onto the surface where the injury is. They begin to organize secreting new basement membrane and when the edges meet, they become anchored in the membrane.
Primary healing is what we say to describe healing of a severing of a wound, or incision. There’s only minor damage with wound edges close to eachother. Bleeding narrows the gap, a clot forms, then a scab, an exudates and then a newly restored surface.
Secondary healing happens when wounds’ edges are not so close. They can happen commonly in skin and the GI tract (such as from a duodenal ulcer). The large wounds produce a lot more debris. The restoration process is extensive. Granulation tissue formation is needed to fill the wound gap, then there’s the aspect of wound contraction. The wound edges come closer toward the center through contraction that reduces the size of the gap. The contraction is caused by myofibroblasts, which are like modified fibroblasts that are derived from pericytes, which have the ability to contract.
Healing tissues
Connective tissue healing is prolonged because of a limited blood supply. Bone, or osseous tissue, has great regeneration abilities because of osteoblasts that are held in reserve, which work with osteoclasts to remodel bones. Tendons and ligaments can jusually recover from injury, but a bad injury can result in scar tissue or rough surface that causes weaker tensile strength or function. Cartilage heals by fibrous repair. Adipose tissue can’t go through mitosis, but precursor cells differentiate to produce new tissue.
Epithelial tissue can regenerate easily enough. They are frequently subject to injury. Regeneration will occur if epithelium damage is superficial. It can’t happen, however, if the basement membrane or intercellular matrix is disrupted, so in these cases fibroblasts will repair with scar tissue.
Glandular tissues are pretty stable and when injured they simply regenerate new tissue. For example, liver can regenerate very well. But if there’s serious damage, then there might be some functional loss.
Nervous tissue is made up of neurons that can’t go through mitosis, so if they’re damaged, then they’re replase by gliosis or proliferation of neuroglia. The neuroglia create a scarlike mass to block damaged axons to grow any further. Peripheral nervous system can replace myelinated neurons if Schwann cells stay undamaged.
Muscle tissues are permanent, so when damaged there is only fibrous repair causing loss of function. But muscles have compensation capabilities. The muscle cells increase in size and strength, called hypertrophy, which is what you get when lifting weights.
Healing problems
Sometimes healing doesn’t go so well. If the damage is too much, then collagen causes an exaggeration in wound contraction process called contracture. This can create distortion, such as seen in disfiguration after serious skin burns.
A second problem are adhesions, which result from inflamed exudates between serous membranes. These cause restriction in movement such as after surgery of heart or lungs, which sometimes require patients to be readmitted due to complications.
Dhiscence is when a healing wound breaks open because of pressure on the tissues. This happens most commonly in the abdominal wall because pressure interferes with formation of maturing collagen. It can lead to violent episodes of coughing, vomiting or diarrhea. A deficiency of vitamin C could also cause dehiscence problems.
Keloids are masses of scar tissue that are protruding through skin. They happen when dermal collagen is overproduced. Proud flesh is a problem of excess granulation tissue. Suture complications can result in cases when keratin is sealed within a suture tract.
Lastly, therapy sometimes can interfere with healting as in radiation or chemicals used in cancer. And anti-inflammatory or immunosuppresants can stop protein synthesis, wound contraction and regeneration.
Controlling healing
Healing is regulated closely, but not well understood. We know of two categories of chemical control factors including growth factors and growth inhibitors. As their names imply, they act in antagonistic ways promoting growth and stopping it. They are vital for migration of fibroblasts and epithelial cells, as well as formation of blood vessels, mitosis, and collagen formation.
Healing depends on cell interactions, especially in the extracellular matrix. Receptors on fibroblasts allow for binding elements of intercellular material. So, the matrix plays a role in regeneration and repair. The matrix interactions provide the regulartory input for healing as long as it is available undamaged.
Somehow, contact between cells physically regulates mitosis. In other words, cells undergoing mitosis stop once contact inhibition happens. You can see this in cells growing in laboratories. They start dividing and migrate, but when they meet they stop.
Worth noting is that growth factor therapy is being studied to better control healing in the future. Preparations of various growth factors could be used for therapy in several instances. Such as burn victims.
Reference
Nowak TJ, Hanfod AG. Pathophysiology: Concepts and applications for health care professionals, 3rd ed. 2004. New York, McGraw-Hill.
Tuesday, September 14, 2010
How cell injury happens and what is the result?
A normal cell has a general organization at a chemical level that involves atoms, molecules moving around in complex fashion that ultimately is critical to the way we live. The cell membrane and various organelles such as the mitochondria all have vital roles to play.
At the cellular level, injury is a result of three basic causes: deficiency, intoxication, or trauma. A deficiency is when the cell lacks a compound of a sort that causes interference with function such as when there’s a dietary deficiency of B vitamins. Intoxication is when a compound present actually poisons the cell, interfering with function such as when a biological infection, or toxic product in the cell like barbiturates. Trauma is when there is actual physical injury to the cell, causing loss of cell integrity such as hypothermia causing ice crystals or hyperthermia causing denaturation of cellular proteins.
The cell can respond in various ways by adapting with reversible (functional or structural) and, sometimes, irreversible (structural or deadly) changes.
The reversible may include alternative metabolisms such as in hypoxia when the cell changes from oxidative phosphorylation to glycolysis, or with altered size as in hypertrophy when demand increases. Reversible changes also include apoptosis that reduces cell numbers, production of cell-stress proteins (like heat stress or heat shock proteins) or organelle changes to make certain enzymes available as in detoxification.
There are also fatty changes as in the liver, residual bodies that are derived from phagosomes when lysosomes aren’t enough, and hyaline changes when proteins accumulate in a cell.
Structural reversible changes include blebs that project out of a cell and myelin figures that are membrane structural abnormalities.
Irreversible injury to cells involve unrecoverable structural changes to the cell membrane causing increased permeability or spillage. It can also involve similar changes to mitochondrial membranes or the structure of other organelles.
Cell death is an irreversible injury called necrosis. Unlike apoptosis, it’s not programmed. It can happen due to coagulation, when proteins are denatured quickly because of acid, heat or enzymes. Caseous necrosis happens as a type of coagulation necrosis in tuberculosis causing a cheeselike appearance. Gangrenous necrosis is another kind that happens when toxic metabolites of bacteria cause reduced blood flow and produce putrefaction.
If coagulation doesn't occur, and tissue breaks down quickly because of lysosomal enzymes then liquefaction necrosis has resulted.
Calcification is a deposition of calcium crystals at sites of necrosis. It occurs when cell injury allows calcium into the cell condensing in mitochondria and causing death. The calcium crystals can start out tiny, but become large masses in a process called dystrophic calcification.
And, when calcium is deposited only as a result of excessive calcium, as in hypercalcemia, then metastatic calcification has occurred. Generally, metatstatic calcium deposits are not severe, but can interfere with lung or kidney function.
Reference
Nowak TJ, Hanfod AG. Pathophysiology: Concepts and applications for health care professionals, 3rd ed. 2004. New York, McGraw-Hill.
Monday, September 13, 2010
The basics of health and disease
What does healthy mean? Some would call it the absence of disease, or when a person can fully use all of his or her physical or mental capacities. But when what we understand as the concept of health is disrupted, in some way or another (which happens inevitably), we call it disease.
The study of the cause of this disease is what we call etiology and the field of etiological study can be specific, as in viral etiology or genetic etiology. Or, when the etiology of a disease is unknown, then idiopathic.
Unlike genetic etiology (think cystic fibrosis), which comes with a genetic structural or functional defect, congenital etiology has to do with factors affecting an embryo’s development in utero (think fetal alcohol syndrome).
The largest category of etiology is acquired disease. These are diseases that develop despite normal genes and embryonic development. Think everything else from tuberculosis to flu, to heart disease and cancer.
Diseases come with symptoms, signs or both. Signs are what is observable by another person – like clammy hands, fever, or irregular pulse. Symptoms are those that are found through physical examination with lab tests, x-rays, surgery.
When there’s a combination of signs and symptoms associated with a disease, we call it a syndrome (as in metabolic syndrome, Down’s syndrome).
After an examination of signs and symptoms, the pattern of development of the disease is pathogenesis. The pathogenesis could describer some kind of initial impact that produced the disease. The resulting condition is a sequela. If the pathogenesis had a rapid onset, it’s acute, and if it develops over time of months or years, then it’s chronic. When pathogenesis involves minor changes, the onset is said to be insidious.
The diagnosis, or identification, of a disease happens (or should happen) after a complete analysis of signs and symptoms with pathogenesis explained. Then, therapy follows with the goal of curing or reducing a patient’s signs or symptoms. The prognosis is the analysis of how a body responds to the therapy.
Reference
Nowak TJ, Hanfod AG. Pathophysiology: Concepts and applications for health care professionals, 3rd ed. 2004. New York, McGraw-Hill.
Sunday, September 12, 2010
What is inflammation?
Inflammation is a normal response of the body that involves an increase of blood flow to a site of injury. The signs of inflammation are redness (rubor), heat (calor), swelling (tumor) and pain (dolor). One other classic sign is loss of function (function laesa).
Acute inflammation is a dramatic localized response to injury. It comes vascular changes increasing blood flow (hyperemia) to the area that cause the redness and warmth as observed along with swelling. There’s also a cellular component, in which large numbers of white blood cells move to the injury to stop infectious agents and clear debris. The cells that come form what is referred to as an exudates.
Chronic inflammation is when inflammation lasts beyond six weeks (subacute applies to inflammation beyond a week, but not lasting as long as six weeks). A chronic response can last months and years. It is essentially a “standoff” between an injury and the body’s defense. They resist each other, but neither is strong enough to beat the other down.
Reference
Nowak TJ, Hanfod AG. Pathophysiology: Concepts and applications for health care professionals, 3rd ed. 2004. New York, McGraw-Hill.
The China Study II: Wheat flour, rice, and cardiovascular disease
In my last post on the China Study II, I analyzed the effect of total and HDL cholesterol on mortality from all cardiovascular diseases. The main conclusion was that total and HDL cholesterol were protective. Total and HDL cholesterol usually increase with intake of animal foods, and particularly of animal fat. The lowest mortality from all cardiovascular diseases was in the highest total cholesterol range, 172.5 to 180; and the highest mortality in the lowest total cholesterol range, 120 to 127.5. The difference was quite large; the mortality in the lowest range was approximately 3.3 times higher than in the highest.
This post focuses on the intake of two main plant foods, namely wheat flour and rice intake, and their relationships with mortality from all cardiovascular diseases. After many exploratory multivariate analyses, wheat flour and rice emerged as the plant foods with the strongest associations with mortality from all cardiovascular diseases. Moreover, wheat flour and rice have a strong and inverse relationship with each other, which suggests a “consumption divide”. Since the data is from China in the late 1980s, it is likely that consumption of wheat flour is even higher now. As you’ll see, this picture is alarming.
The main model and results
All of the results reported here are from analyses conducted using WarpPLS. Below is the model with the main results of the analyses. (Click on it to enlarge. Use the "CRTL" and "+" keys to zoom in, and CRTL" and "-" to zoom out.) The arrows explore associations between variables, which are shown within ovals. The meaning of each variable is the following: SexM1F2 = sex, with 1 assigned to males and 2 to females; MVASC = mortality from all cardiovascular diseases (ages 35-69); TKCAL = total calorie intake per day; WHTFLOUR = wheat flour intake (g/day); and RICE = and rice intake (g/day).

The variables to the left of MVASC are the main predictors of interest in the model. The one to the right is a control variable – SexM1F2. The path coefficients (indicated as beta coefficients) reflect the strength of the relationships. A negative beta means that the relationship is negative; i.e., an increase in a variable is associated with a decrease in the variable that it points to. The P values indicate the statistical significance of the relationship; a P lower than 0.05 generally means a significant relationship (95 percent or higher likelihood that the relationship is “real”).
In summary, the model above seems to be telling us that:
- As rice intake increases, wheat flour intake decreases significantly (beta=-0.84; P<0.01). This relationship would be the same if the arrow pointed in the opposite direction. It suggests that there is a sharp divide between rice-consuming and wheat flour-consuming regions.
- As wheat flour intake increases, mortality from all cardiovascular diseases increases significantly (beta=0.32; P<0.01). This is after controlling for the effects of rice and total calorie intake. That is, wheat flour seems to have some inherent properties that make it bad for one’s health, even if one doesn’t consume that many calories.
- As rice intake increases, mortality from all cardiovascular diseases decreases significantly (beta=-0.24; P<0.01). This is after controlling for the effects of wheat flour and total calorie intake. That is, this effect is not entirely due to rice being consumed in place of wheat flour. Still, as you’ll see later in this post, this relationship is nonlinear. Excessive rice intake does not seem to be very good for one’s health either.
- Increases in wheat flour and rice intake are significantly associated with increases in total calorie intake (betas=0.25, 0.33; P<0.01). This may be due to wheat flour and rice intake: (a) being themselves, in terms of their own caloric content, main contributors to the total calorie intake; or (b) causing an increase in calorie intake from other sources. The former is more likely, given the effect below.
- The effect of total calorie intake on mortality from all cardiovascular diseases is insignificant when we control for the effects of rice and wheat flour intakes (beta=0.08; P=0.35). This suggests that neither wheat flour nor rice exerts an effect on mortality from all cardiovascular diseases by increasing total calorie intake from other food sources.
- Being female is significantly associated with a reduction in mortality from all cardiovascular diseases (beta=-0.24; P=0.01). This is to be expected. In other words, men are women with a few design flaws, so to speak. (This situation reverses itself a bit after menopause.)
Wheat flour displaces rice
The graph below shows the shape of the association between wheat flour intake (WHTFLOUR) and rice intake (RICE). The values are provided in standardized format; e.g., 0 is the mean (a.k.a. average), 1 is one standard deviation above the mean, and so on. The curve is the best-fitting U curve obtained by the software. It actually has the shape of an exponential decay curve, which can be seen as a section of a U curve. This suggests that wheat flour consumption has strongly displaced rice consumption in several regions in China, and also that wherever rice consumption is high wheat flour consumption tends to be low.

As wheat flour intake goes up, so does cardiovascular disease mortality
The graphs below show the shapes of the association between wheat flour intake (WHTFLOUR) and mortality from all cardiovascular diseases (MVASC). In the first graph, the values are provided in standardized format; e.g., 0 is the mean (or average), 1 is one standard deviation above the mean, and so on. In the second graph, the values are provided in unstandardized format and organized in terciles (each of three equal intervals).


The curve in the first graph is the best-fitting U curve obtained by the software. It is a quasi-linear relationship. The higher the consumption of wheat flour in a county, the higher seems to be the mortality from all cardiovascular diseases. The second graph suggests that mortality in the third tercile, which represents a consumption of wheat flour of 501 to 751 g/day (a lot!), is 69 percent higher than mortality in the first tercile (0 to 251 g/day).
Rice seems to be protective, as long as intake is not too high
The graphs below show the shapes of the association between rice intake (RICE) and mortality from all cardiovascular diseases (MVASC). In the first graph, the values are provided in standardized format. In the second graph, the values are provided in unstandardized format and organized in terciles.


Here the relationship is more complex. The lowest mortality is clearly in the second tercile (206 to 412 g/day). There is a lot of variation in the first tercile, as suggested by the first graph with the U curve. (Remember, as rice intake goes down, wheat flour intake tends to go up.) The U curve here looks similar to the exponential decay curve shown earlier in the post, for the relationship between rice and wheat flour intake.
In fact, the shape of the association between rice intake and mortality from all cardiovascular diseases looks a bit like an “echo” of the shape of the relationship between rice and wheat flour intake. Here is what is creepy. This echo looks somewhat like the first curve (between rice and wheat flour intake), but with wheat flour intake replaced by “death” (i.e., mortality from all cardiovascular diseases).
What does this all mean?
- Wheat flour displacing rice does not look like a good thing. Wheat flour intake seems to have strongly displaced rice intake in the counties where it is heavily consumed. Generally speaking, that does not seem to have been a good thing. It looks like this is generally associated with increased mortality from all cardiovascular diseases.
- High glycemic index food consumption does not seem to be the problem here. Wheat flour and rice have very similar glycemic indices (but generally not glycemic loads; see below). Both lead to blood glucose and insulin spikes. Yet, rice consumption seems protective when it is not excessive. This is true in part (but not entirely) because it largely displaces wheat flour. Moreover, neither rice nor wheat flour consumption seems to be significantly associated with cardiovascular disease via an increase in total calorie consumption. This is a bit of a blow to the theory that high glycemic carbohydrates necessarily cause obesity, diabetes, and eventually cardiovascular disease.
- The problem with wheat flour is … hard to pinpoint, based on the results summarized here. Maybe it is the fact that it is an ultra-refined carbohydrate-rich food; less refined forms of wheat could be healthier. In fact, the glycemic loads of less refined carbohydrate-rich foods tend to be much lower than those of more refined ones. (Also, boiled brown rice has a glycemic load that is about three times lower than that of whole wheat bread; whereas the glycemic indices are about the same.) Maybe the problem is wheat flour's gluten content. Maybe it is a combination of various factors, including these.
Reference
Kock, N. (2010). WarpPLS 1.0 User Manual. Laredo, Texas: ScriptWarp Systems.
Acknowledgment and notes
- Many thanks are due to Dr. Campbell and his collaborators for collecting and compiling the data used in this analysis. The data is from this site, created by those researchers to disseminate their work in connection with a study often referred to as the “China Study II”. It has already been analyzed by other bloggers. Notable analyses have been conducted by Ricardo at Canibais e Reis, Stan at Heretic, and Denise at Raw Food SOS.
- The path coefficients (indicated as beta coefficients) reflect the strength of the relationships; they are a bit like standard univariate (or Pearson) correlation coefficients, except that they take into consideration multivariate relationships (they control for competing effects on each variable). Whenever nonlinear relationships were modeled, the path coefficients were automatically corrected by the software to account for nonlinearity.
- The software used here identifies non-cyclical and mono-cyclical relationships such as logarithmic, exponential, and hyperbolic decay relationships. Once a relationship is identified, data values are corrected and coefficients calculated. This is not the same as log-transforming data prior to analysis, which is widely used but only works if the underlying relationship is logarithmic. Otherwise, log-transforming data may distort the relationship even more than assuming that it is linear, which is what is done by most statistical software tools.
- The R-squared values reflect the percentage of explained variance for certain variables; the higher they are, the better the model fit with the data. In complex and multi-factorial phenomena such as health-related phenomena, many would consider an R-squared of 0.20 as acceptable. Still, such an R-squared would mean that 80 percent of the variance for a particularly variable is unexplained by the data.
- The P values have been calculated using a nonparametric technique, a form of resampling called jackknifing, which does not require the assumption that the data is normally distributed to be met. This and other related techniques also tend to yield more reliable results for small samples, and samples with outliers (as long as the outliers are “good” data, and are not the result of measurement error).
- Only two data points per county were used (for males and females). This increased the sample size of the dataset without artificially reducing variance, which is desirable since the dataset is relatively small. This also allowed for the test of commonsense assumptions (e.g., the protective effects of being female), which is always a good idea in a complex analysis because violation of commonsense assumptions may suggest data collection or analysis error. On the other hand, it required the inclusion of a sex variable as a control variable in the analysis, which is no big deal.
- Since all the data was collected around the same time (late 1980s), this analysis assumes a somewhat static pattern of consumption of rice and wheat flour. In other words, let us assume that variations in consumption of a particular food do lead to variations in mortality. Still, that effect will typically take years to manifest itself. This is a major limitation of this dataset and any related analyses.
- Mortality from schistosomiasis infection (MSCHIST) does not confound the results presented here. Only counties where no deaths from schistosomiasis infection were reported have been included in this analysis. Mortality from all cardiovascular diseases (MVASC) was measured using the variable M059 ALLVASCc (ages 35-69). See this post for other notes that apply here as well.
Saturday, September 11, 2010
What causes a fever?
When inflammation comes with a body temperature that is elevated above normal, we call it a fever or pyrexia. The change in temperature is not a defect, but an adjustment by the hypothalamus to a new set point. The set point is established in consequence of release of fever-producing factors called pyrogens, whether endogenous or exogenous. Endogenous pyrogens are produced upon stimulation of exogenous agents.
The fever is a response to infectious, toxic or immunologic disease or injury, at least in warm-blooded animals – although cold-blooded animals like lizards often treat themselves similarly by lying in the sun to raise body temperature.
The fever enhances functions of the immune system and phagocytosis. Also, there are a few bacteria and viruses that reproduce more slowly in the heated temperature because of possible interference with uptake of iron.
So, our initial idea of a fever as something to treat may actually be our bodies’ ways of treating themselves to some kind of moderate degree. But antibiotics are a modern intervention that have given us the capacity to thwart the need of suffering through a fever.
Besides, a fever can actually cause damage itself as in the brain or in pregnancy. The excess heat can cause hyperthermia that creates cranial pressure or can harm a fetus, respectively.
Antipyretic therapy, such as with acetylsalicylic acid, is the way to go. They inhibit prostaglandin production in they hypothalamus, which results in a block of the set point elevation and returns temperature to a normal level.
But children with flu or measles shouldn’t take acetylsalicylic acid because of association with Reyes syndrome, so ibuprofen or something else should be used for children.
Reference
Nowak TJ, Hanfod AG. Pathophysiology: Concepts and applications for health care professionals, 3rd ed. 2004. New York, McGraw-Hill.
Thursday, September 9, 2010
Giving Children the Chance at a Healthy Future
 |
Encouraging healthy habits like exercise and eating right early on helps stave off childhood obesity. |
The government statistics about childhood obesity are shocking:
- Childhood obesity has increased more than fourfold among ages 6 to 11 in the United States
- More than 23 million children and teenagers in the United States ages 2 to 19 are obesity or overweight
- Nearly one third of America’s children are at early risk for Type 2 diabetes, high blood pressure, heart disease and even stroke
- The current generation may have shorter lifespans than their parents
During this month of national attention on this epidemic, parents and responsible adult role models can surely do their part by encouraging the overall goal of living a healthier lifestyle, one that emphasizes healthy habits such as eating right and exercising regularly – whether a child is an infant, toddler, pre-teen, or teen.
Infant Introductions
A newborn's nutritional needs are met almost entirely through breastmilk or formula, but by six months dietary habits can begin to develop with the introduction of solid foods. The foods that a baby eats can shape preferences later in life.
Parents should seek to give infants solid foods – fortified infant cereals and strained fruits, vegetables, and pureed meats – that emphasize natural whole food flavors and that are not sweetened with added sugars. During this stage in life, it’s also well-heeded advice to avoid introducing fruit juices or any kind of sugar-sweetened drinks.
Tips for Toddlers and Preschoolers
As infants grow into toddlers, their energy grows and so do their appetites for snacks. Most snacks, unfortunately, come in the form of sodium, starch and fat – buttered noodles, potato chips, French fries – and too little protein, fiber and vitamins and minerals.
Parents can promote snacking on whole foods by having fresh whole fruits and vegetables readily available and in easy reach to children. Plus, they can encourage drinking of water and milk by keeping fruit juices and sugar-sweetened drinks such as soda pop out of reach.
By the time children are in preschool they may have already discovered sedentary activities such as television and videogames. However, adults can help children get the exercise they need by providing toys like tricycles and taking them to visit to the park and playground regularly.
Elements of Elementary School Age
When children reach elementary school, they are ready to learn the basics of making time for regular physical activity and making good food choices for maintaining a healthy weight.
Keeping kids moving can be as simple as getting them involved in regular activities: children can help with daily chores such as sweeping, vacuuming or gardening; or they can get signed up for team or individual sports such as swimming, gymnastics, dance, soccer, T-ball and basketball. The goal is anything that keeps them off the couch.
Parents can provide children with guidance on food choices by teaching them guidelines – such as those given by the Food Guide Pyramid – or by simply providing direction at home and when eating out. For example, at restaurants, adults can encourage healthy alternatives such as apples instead of French fries.
Puberty Principles
Preteens and teens begin to become more conscious of weight and body image. So, parents should keep a close watch for potential eating disorders or other possible unhealthy behaviors. Parents should reinforce positive behaviors such as healthy eating patterns and regular exercise.
Tweens with large appetites often need guidance in understanding the value of portion size, nutrient density, and balance in meals for nutrition and weight management. Parents can help by teaching how to watch amounts of calories, sugar, salt and fat, while identifying foods higher in fiber, protein, and calcium.
Exercise can begin with recreational activities, individual and team sports. At preadolescence, however, outdoor activities like hiking, boating, and snowboarding can also be exciting, which lend parents more opportunities to encourage physical fitness.
Health Begins at Home
At any age, there's no better way to help a child to adopt the habits of a healthy lifestyle than by setting an example – that means adults adopting healthy habits too.
Parents should become involved with exercise for children by picking activities that the whole family can enjoy such as bike rides, nature walks and games. Parents can also get children involved in preparing healthy meals at home and eating them together.
In addition, parents can reward children's healthy behaviors to keep them motivated, which invites them to adopt healthy habits for life that ultimately a better future.
Subscribe to:
Posts (Atom)