First I built a model that explores relationships with the goal of testing the assumption that the consumption of animal protein causes colorectal cancer, via an intermediate effect on total cholesterol. I built the model with various hypothesized associations to explore several relationships simultaneously, including some commonsense ones. Including commonsense relationships is usually a good idea in exploratory multivariate analyses.
The model is shown on the graph below, with the results. (Click on it to enlarge. Use the "CRTL" and "+" keys to zoom in, and CRTL" and "-" to zoom out.) The arrows explore causative associations between variables. The variables are shown within ovals. The meaning of each variable is the following: aprotein = animal protein consumption; pprotein = plant protein consumption; cholest = total cholesterol; crcancer = colorectal cancer.

The path coefficients (indicated as beta coefficients) reflect the strength of the relationships; they are a bit like standard univariate (or Pearson) correlation coefficients, except that they take into consideration multivariate relationships (they control for competing effects on each variable). A negative beta means that the relationship is negative; i.e., an increase in a variable is associated with a decrease in the variable that it points to.
The P values indicate the statistical significance of the relationship; a P lower than 0.05 means a significant relationship (95 percent or higher likelihood that the relationship is real). The R-squared values reflect the percentage of explained variance for certain variables; the higher they are, the better the model fit with the data. Ignore the “(R)1i” below the variable names; it simply means that each of the variables is measured through a single indicator (or a single measure; that is, the variables are not latent variables).
I should note that the P values have been calculated using a nonparametric technique, a form of resampling called jackknifing, which does not require the assumption that the data is normally distributed to be met. This is good, because I checked the data, and it does not look like it is normally distributed. So what does the model above tell us? It tells us that:
- As animal protein consumption increases, colorectal cancer decreases, but not in a statistically significant way (beta=-0.13; P=0.11).
- As animal protein consumption increases, plant protein consumption decreases significantly (beta=-0.19; P<0.01). This is to be expected.
- As plant protein consumption increases, colorectal cancer increases significantly (beta=0.30; P=0.03). This is statistically significant because the P is lower than 0.05.
- As animal protein consumption increases, total cholesterol increases significantly (beta=0.20; P<0.01). No surprise here. And, by the way, the total cholesterol levels in this study are quite low; an overall increase in them would probably be healthy.
- As plant protein consumption increases, total cholesterol decreases significantly (beta=-0.23; P=0.02). No surprise here either, because plant protein consumption is negatively associated with animal protein consumption; and the latter tends to increase total cholesterol.
- As total cholesterol increases, colorectal cancer increases significantly (beta=0.45; P<0.01). Big surprise here!
Why the big surprise with the apparently strong relationship between total cholesterol and colorectal cancer? The reason is that it does not make sense, because animal protein consumption seems to increase total cholesterol (which we know it usually does), and yet animal protein consumption seems to decrease colorectal cancer.
When something like this happens in a multivariate analysis, it usually is due to the model not incorporating a variable that has important relationships with the other variables. In other words, the model is incomplete, hence the nonsensical results. As I said before in a previous post, relationships among variables that are implied by coefficients of association must also make sense.
Now, Denise pointed out that the missing variable here possibly is schistosomiasis infection. The dataset that she provided included that variable, even though there were some missing values (about 28 percent of the data for that variable was missing), so I added it to the model in a way that seems to make sense. The new model is shown on the graph below. In the model, schisto = schistosomiasis infection.

So what does this new, and more complete, model tell us? It tells us some of the things that the previous model told us, but a few new things, which make a lot more sense. Note that this model fits the data much better than the previous one, particularly regarding the overall effect on colorectal cancer, which is indicated by the high R-squared value for that variable (R-squared=0.73). Most notably, this new model tells us that:
- As schistosomiasis infection increases, colorectal cancer increases significantly (beta=0.83; P<0.01). This is a MUCH STRONGER relationship than the previous one between total cholesterol and colorectal cancer; even though some data on schistosomiasis infection for a few counties is missing (the relationship might have been even stronger with a complete dataset). And this strong relationship makes sense, because schistosomiasis infection is indeed associated with increased cancer rates. More information on schistosomiasis infections can be found here.
- Schistosomiasis infection has no significant relationship with these variables: animal protein consumption, plant protein consumption, or total cholesterol. This makes sense, as the infection is caused by a worm that is not normally present in plant or animal food, and the infection itself is not specifically associated with abnormalities that would lead one to expect major increases in total cholesterol.
- Animal protein consumption has no significant relationship with colorectal cancer. The beta here is very low, and negative (beta=-0.03).
- Plant protein consumption has no significant relationship with colorectal cancer. The beta for this association is positive and nontrivial (beta=0.15), but the P value is too high (P=0.20) for us to discard chance within the context of this dataset. A more targeted dataset, with data on specific plant foods (e.g., wheat-based foods), could yield different results – maybe more significant associations, maybe less significant.
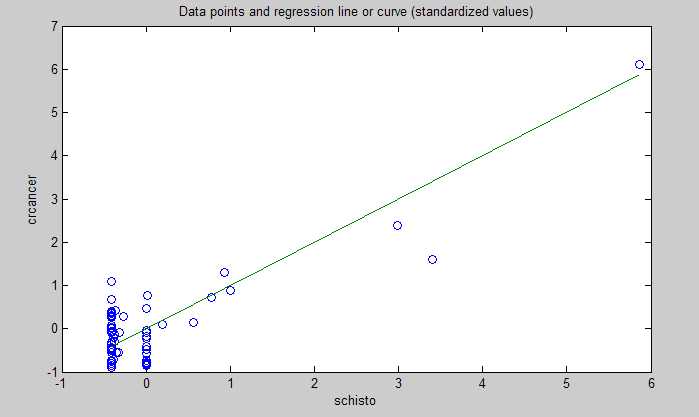
Below is the plot showing the relationship between schistosomiasis infection and colorectal cancer. The values are standardized, which means that the zero on the horizontal axis is the mean of the schistosomiasis infection numbers in the dataset. The shape of the plot is the same as the one with the unstandardized data. As you can see, the data points are very close to a line, which suggests a very strong linear association.
So, in summary, this multivariate analysis vindicates pretty much everything that Denise said in her July 16, 2010 post. It even supports Denise’s warning about jumping to conclusions too early regarding the possible relationship between wheat consumption and colorectal cancer (previously highlighted by a univariate analysis). Not that those conclusions are wrong; they may well be correct.
This multivariate analysis also supports Dr. Campbell’s assertion about the quality of the China Study data. The data that I analyzed was already grouped by county, so the sample size (65 cases) was not so high as to cast doubt on P values. (Having said that, small samples create problems of their own, such as low statistical power and an increase in the likelihood of error-induced bias.) The results summarized in this post also make sense in light of past empirical research.
It is very good data; data that needs to be properly analyzed!