Showing posts with label vitamin D. Show all posts

Monday, November 11, 2013

Latitude and cancer rates in US states: Aaron Blaisdell’s intuition confirmed


In the comments section of my previous post on cancer rates in the US states () my friend Aaron Blaisdell noted that: …comparing states that are roughly comparable in terms of number of seniors per 1000 individuals, latitude appears to have the largest effect on rates of cancer.

Good point, so I collected data on the latitudes of US states, built a more complex model (with several multivariate controls), and analyzed it with WarpPLS 4.0 ().

The coefficient of association for the effect of latitude on cancer rates (path coefficient) turned out to be 0.35. Its P value was lower than 0.001, meaning that the probability that this is a false positive is less than a tenth of a percent, or that we can be 99.9 percent confident that this is not a false positive.

This was calculated controlling for the: (a) proportion of seniors in the population (population age); (b) proportion of obese individuals in the population (obesity rates); and (c) the possible moderating effect of latitude on the effect of population age on cancer rates. The graph below shows this multivariate-adjusted association.


What is cool about a multivariate analysis is that you can control for certain effects. For example, since we are controlling for proportion of seniors in the population (population age), the fact that we have a state with a very low proportion of seniors (Alaska) does not tilt the effect toward that outlier as much as it would if we had not controlled for the proportion of seniors. This is a mathematical property that is difficult to grasp, but that makes multivariate adjustment such a powerful technique.

I should note that the 99.9 percent confidence mentioned above refers to the coefficient of association. That is, we are quite confident that the coefficient of association is not zero; that is it. The P value does not support the hypothesized direction of causality (latitude -> cancer) or exclude the possibility of a major confounder causing the effect.

Nonetheless, among the newest features of WarpPLS 4.0 (still a beta version) are several causality assessment coefficients: path-correlation signs, R-squared contributions, path-correlation ratios, path-correlation differences, Warp2 bivariate causal direction ratios, Warp2 bivariate causal direction differences, Warp3 bivariate causal direction ratios, and Warp3 bivariate causal direction differences. Without going into a lot of technical detail, which you can get from the User Manual () without even having to install the software, I can tell you that all of these causality assessment coefficients support the hypothesized direction of causality.

Also, while we cannot exclude the possibility of a major confounder causing the effect, we included two possible confounders in the analysis and controlled for their effects. They were the proportion of seniors in the population (population age) and the proportion of obese individuals in the population (obesity rates).

Having said all of the above, I should also say that the effect is similar in magnitude to the effect of population age on cancer rates, which I discussed in the previous post linked above. That is, it is not the type of effect that would be clearly noticeable in a person’s normal life.

Sunlight exposure? Maybe.

We do know that our body naturally produces as much as 10,000 IU of vitamin D based on a few minutes of sun exposure when the sun is high (). Getting that much vitamin D from dietary sources is very difficult, even after “fortification”.

Monday, July 29, 2013

Could grain-fed beef liver be particularly nutritious?


There is a pervasive belief today that grain-fed beef is unhealthy, a belief that I addressed before in this blog () and that I think is exaggerated. This general belief seems to also apply to a related meat, one that is widely acknowledged as a major micronutrient “powerhouse”, namely grain-fed beef liver.

Regarding grain-fed beef liver, the idea is that cattle that are grain-fed tend to develop a mild form of fatty liver disease. This I am inclined to agree with.

However, I am not convinced that this is such a bad thing for those who eat grain-fed beef liver.

In most animals, including Homo sapiens, fatty liver disease seems to be associated with extra load being put on the liver. Possible reasons for this are accelerated growth, abnormally high levels of body fat, and ingestion of toxins beyond a certain hormetic threshold (e.g., alcohol).

In these cases, what would one expect to see as a body response? The extra load is associated with high oxidative stress and rate of metabolic work. In response, the body should shuttle more antioxidants and metabolism catalysts to the organ being overloaded. Fat-soluble vitamins can act as antioxidants and catalysts in various metabolic processes, among other important functions. They require fat to be stored, and can then be released over time, which is a major advantage over water-soluble vitamins; fat-soluble vitamins are longer-acting.

So you would expect an overloaded liver to have more fat in it, and also a greater concentration of fat-soluble vitamins. This would include vitamin A, which would give the liver an unnatural color, toward the orange-yellow range of the spectrum.

Grain-fed beef liver, like the muscle meat of grain-fed cattle, tends to have more fat than that of grass-fed animals. One function of this extra fat could be to store fat-soluble vitamins. This extra fat appears to have a higher omega-6 fat content as well. Still, beef liver is a fairly lean meat; with about 5 g of fat per 100 g of weight, and only 20 mg or so of omega-6 fat. Clearly consumption of beef liver in moderation is unlikely to lead to a significant increase in omega-6 fat content in one’s diet (). By consumption in moderation I mean approximately once a week.

The photo below, from Wikipedia, is of a dish prepared with foie gras. That is essentially the liver of a duck or goose that has been fattened through force-feeding, until the animal develops fatty liver disease. This “diseased” liver is particularly rich in fat-soluble vitamins; e.g., it is the best known source of the all-important vitamin K2.


Could the same happen, although to a lesser extent, with grain-fed beef liver? I don’t think it is unreasonable to speculate that it could.

Monday, February 28, 2011

Vitamin D production from UV radiation: The effects of total cholesterol and skin pigmentation

Our body naturally produces as much as 10,000 IU of vitamin D based on a few minutes of sun exposure when the sun is high. Getting that much vitamin D from dietary sources is very difficult, even after “fortification”.

The above refers to pre-sunburn exposure. Sunburn is not associated with increased vitamin D production; it is associated with skin damage and cancer.

Solar ultraviolet (UV) radiation is generally divided into two main types: UVB (wavelength: 280–320 nm) and UVA (320–400 nm). Vitamin D is produced primarily based on UVB radiation. Nevertheless, UVA is much more abundant, amounting to about 90 percent of the sun’s UV radiation.

UVA seems to cause the most skin damage, although there is some debate on this. If this is correct, one would expect skin pigmentation to be our body’s defense primarily against UVA radiation, not UVB radiation. If so, one’s ability to produce vitamin D based on UVB should not go down significantly as one’s skin becomes darker.

Also, vitamin D and cholesterol seem to be closely linked. Some argue that one is produced based on the other; others that they have the same precursor substance(s). Whatever the case may be, if vitamin D and cholesterol are indeed closely linked, one would expect low cholesterol levels to be associated with low vitamin D production based on sunlight.

Bogh et al. (2010) recently published a very interesting study. The link to the study was provided by Ted Hutchinson in the comments sections of a previous post on vitamin D. (Thanks Ted!) The study was published in a refereed journal with a solid reputation, the Journal of Investigative Dermatology.

The study by Bogh et al. (2010) is particularly interesting because it investigates a few issues on which there is a lot of speculation. Among the issues investigated are the effects of total cholesterol and skin pigmentation on the production of vitamin D from UVB radiation.

The figure below depicts the relationship between total cholesterol and vitamin D production based on UVB radiation. Vitamin D production is referred to as “delta 25(OH)D”. The univariate correlation is a fairly high and significant 0.51.


25(OH)D is the abbreviation for calcidiol, a prehormone that is produced in the liver based on vitamin D3 (cholecalciferol), and then converted in the kidneys into calcitriol, which is usually abbreviated as 1,25-(OH)2D3. The latter is the active form of vitamin D.

The table below shows 9 columns; the most relevant ones are the last pair at the right. They are the delta 25(OH)D levels for individuals with dark and fair skin after exposure to the same amount of UVB radiation. The difference in vitamin D production between the two groups is statistically indistinguishable from zero.


So there you have it. According to this study, low total cholesterol seems to be associated with impaired ability to produce vitamin D from UVB radiation. And skin pigmentation appears to have little  effect on the amount of vitamin D produced.

I hope that there will be more research in the future investigating this study’s claims, as the study has a few weaknesses. For example, if you take a look at the second pair of columns from the right on the table above, you’ll notice that the baseline 25(OH)D is lower for individuals with dark skin. The difference was just short of being significant at the 0.05 level.

What is the problem with that? Well, one of the findings of the study was that lower baseline 25(OH)D levels were significantly associated with higher delta 25(OH)D levels. Still, the baseline difference does not seem to be large enough to fully explain the lack of difference in delta 25(OH)D levels for individuals with dark and fair skin.

A widely cited dermatology researcher, Antony Young, published an invited commentary on this study in the same journal issue (Young, 2010). The commentary points out some weaknesses in the study, but is generally favorable. The weaknesses include the use of small sub-samples.

References

Bogh, M.K.B., Schmedes, A.V., Philipsen, P.A., Thieden, E., & Wulf, H.C. (2010). Vitamin D production after UVB exposure depends on baseline vitamin D and total cholesterol but not on skin pigmentation. Journal of Investigative Dermatology, 130(2), 546–553.

Young, A.R. (2010). Some light on the photobiology of vitamin D. Journal of Investigative Dermatology, 130(2), 346–348.

Monday, December 13, 2010

What is a reasonable vitamin D level?

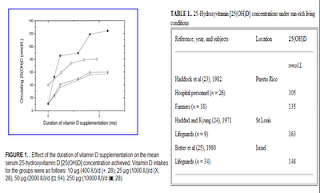
The figure and table below are from Vieth (1999); one of the most widely cited articles on vitamin D. The figure shows the gradual increase in blood concentrations of 25-Hydroxyvitamin, or 25(OH)D, following the start of daily vitamin D3 supplementation of 10,000 IU/day. The table shows the average levels for people living and/or working in sun-rich environments; vitamin D3 is produced by the skin based on sun exposure.


25(OH)D is also referred to as calcidiol. It is a pre-hormone that is produced by the liver based on vitamin D3. To convert from nmol/L to ng/mL, divide by 2.496. The figure suggests that levels start to plateau at around 1 month after the beginning of supplementation, reaching a point of saturation after 2-3 months. Without supplementation or sunlight exposure, levels should go down at a comparable rate. The maximum average level shown on the table is 163 nmol/L (65 ng/mL), and refers to a sample of lifeguards.

From the figure we can infer that people on average will plateau at approximately 130 nmol/L, after months of 10,000 IU/d supplementation. That is 52 ng/mL. Assuming a normal distribution with a standard deviation of about 20 percent of the range of average levels, we can expect about 68 percent of the population to be in the 42 to 63 ng/mL range.

This might be the range most of us should expect to be in at an intake of 10,000 IU/d. This is the equivalent to the body’s own natural production through sun exposure.

Approximately 32 percent of the population can be expected to be outside this range. A person who is two standard deviations (SDs) above the mean (i.e., average) would be at around 73 ng/mL. Three SDs above the mean would be 83 ng/mL. Two SDs below the mean would be 31 ng/mL.

There are other factors that may affect levels. For example, being overweight tends to reduce them. Excess cortisol production, from stress, may also reduce them.

Supplementing beyond 10,000 IU/d to reach levels much higher than those in the range of 42 to 63 ng/mL may not be optimal. Interestingly, one cannot overdose through sun exposure, and the idea that people do not produce vitamin D3 after 40 years of age is a myth.

One would be taking in about 14,000 IU/d of vitamin D3 by combining sun exposure with a supplemental dose of 4,000 IU/d. Clear signs of toxicity may not occur until one reaches 50,000 IU/d. Still, one may develop other complications, such as kidney stones, at levels significantly above 10,000 IU/d.

See this post by Chris Masterjohn, which makes a different argument, but with somewhat similar conclusions. Chris points out that there is a point of saturation above which the liver is unable to properly hydroxylate vitamin D3 to produce 25(OH)D.

How likely it is that a person will develop complications like kidney stones at levels above 10,000 IU/d, and what the danger threshold level could be, are hard to guess. Kidney stone incidence is a sensitive measure of possible problems; but it is, by itself, an unreliable measure. The reason is that it is caused by factors that are correlated with high levels of vitamin D, where those levels may not be the problem.

There is some evidence that kidney stones are associated with living in sunny regions. This is not, in my view, due to high levels of vitamin D3 production from sunlight. Kidney stones are also associated with chronic dehydration, and populations living in sunny regions may be at a higher than average risk of chronic dehydration. This is particularly true for sunny regions that are also very hot and/or dry.

Reference

Vieth, R. (1999). Vitamin D supplementation, 25-hydroxyvitamin D concentrations, and safety. American Journal of Clinical Nutrition, 69(5), 842-856.

Wednesday, August 4, 2010

The baffling rise in seasonal allergies: Global warming or obesity?

The July 26, 2010 issue of Fortune has an interesting set of graphs on page 14. It shows the rise of allergies in the USA, together with figures on lost productivity, doctor visits, and medical expenditures. (What would you expect? This is Fortune, and money matters.) It also shows some cool maps with allergen concentrations, and how they are likely to increase with global warming. (See below; click on it to enlarge; use the "CRTL" and "+" keys to zoom in, and CRTL" and "-" to zoom out.)


The implication: A rise in global temperatures is causing an increase in allergy cases. Supposedly the spring season starts earlier, with more pollen being produced overall, and thus more allergy cases.

Really!?

I checked their numbers against population growth, because as the population of a country increases, so will the absolute number of allergy cases (as well as cancer cases, and cases of almost any disease). What is important is whether there has been an increase in allergy rates, or the percentage of the population suffering from allergies. Well, indeed, allergy rates have been increasing.

Now, I don’t know about your neck of the woods, but temperatures have been unusually low this year in South Texas. Global warming may be happening, but given recent fluctuations in temperature, I am not sure global warming explains the increases in allergy rates. Particularly the spike in allergy rates in 2010; this seems to be very unlikely to be caused by global warming.

And I have my own experience of going from looking like a seal to looking more like a human being. When I was a seal (i.e., looked like one), I used to have horrible seasonal pollen allergies. Then I lost 60 lbs, and my allergies diminished dramatically. Why? Body fat secretes a number of pro-inflammatory hormones (see, e.g., this post, and also this one), and allergies are essentially exaggerated inflammatory responses.

So I added obesity rates to the mix, and came up with the table and graph below (click on it to enlarge).


Obesity rates and allergies do seem to go hand in hand, don’t you think? The correlation between obesity and allergy rates is a high 0.87!

Assuming that this correlation reflects reasonably well the relationship between obesity and allergy rates (something that is not entirely clear given the small sample), obesity would still explain only 75.7 percent of the variance in allergy rates (this number is the correlation squared). That is, about 24.3 percent of the variance in allergy rates would be due to other missing factors.

A strong candidate for missing factor is something that makes people obese in the first place, namely consumption of foods rich in refined grains, seeds, and sugars. Again, in my experience, removing these foods from my diet reduced the intensity of allergic reactions, but not as much as losing a significant amount of body fat. We are talking about things like cereals, white bread, doughnuts, pasta, pancakes covered with syrup, regular sodas, and fruit juices. Why? These foods also seem to increase serum concentrations of pro-inflammatory hormones within hours of their consumption.

Other candidates are vitamin D levels, and lack of exposure to natural environments during childhood, just to name a few. People seem to avoid the sun like the plague these days, which can lower their vitamin D levels. This is a problem because vitamin D modulates immune responses; so it is important in the spring, as well as in the winter. The lack of exposure to natural environments during childhood may make people more sensitive to natural allergens, like pollen.

Saturday, February 6, 2010

Vitamin D levels: Sunlight, age, and toxicity

Calcidiol is a pre-hormone that is produced based on vitamin D3 in the liver. Blood concentration of calcidiol is considered to be a reliable indicator of vitamin D status. In the research literature, calcidiol is usually referred to as 25-Hydroxyvitamin or 25(OH)D. Calcidiol is converted in the kidneys into calcitriol, which is the active form of vitamin D.

The table below (from: Vieth, 1999; full reference at the end of this post; click on it to enlarge), shows the average blood vitamin D levels of people living or working in sun-rich environments. To convert from nmol/L to ng/mL, divide by 2.496. For example, 100 nmol/L = 100 / 2.496 ng/mL = 40.1 ng/mL. At the time of this writing, Vieth (1999) had 692 citations on Google Scholar, and probably more than that on Web of Science. This article has had, and continues having, a high impact among researchers.


The maximum average level of blood (or serum) vitamin D shown in the table is 163 nmol/L (65 ng/mL). Given that the human body produces vitamin D naturally from sunlight, it is reasonable to assume that those blood vitamin D levels are not yet at the toxic range. In fact, one of the individuals, a farmer in Puerto Rico, had a level of 225 nmol/L (90 ng/mL). That individual had no signs of toxicity.

Several studies show that pre-sunburn full-body exposure to sunlight is equivalent to an oral vitamin D intake of approximately 250 µg (10,000 IU).

In spite of claims to the contrary, vitamin D production based on sunlight does not cease after 40 years of age or so. Studies reviewed by Vieth suggest that among the elderly (i.e., those aged 65 or above) pre-sunburn full-body exposure to sunlight is equivalent to an oral vitamin D intake of 218 µg (8,700 IU).

Sunlight-induced vitamin D production does seem to decrease with age, but not dramatically.

Post-sunburn sunlight exposure does not increase vitamin D production. Since each person is different, a good rule of thumb to estimate the number of minutes of sunlight exposure needed to maximize vitamin D production is the number of minutes preceding sunburn. For a light-skinned person, this can be as little as 7 minutes.

Vitamin D accumulation in the body follows a battery-like pattern, increasing and decreasing gradually. The figure below, from Vieth’s article, shows the gradual increase in blood vitamin D concentrations following the start of daily supplementation. This suggests that levels start to plateau at around 1 month, with higher levels reaching a plateau after 2 months.


While sunlight exposure does not lead to toxic levels of vitamin D, oral intake may. Below is a figure, also from Vieth’s article, that plots blood levels of vitamin D against oral intake amounts. The X’s indicate points at which intoxication symptoms were observed. While typically intoxication starts at the 50,000 IU intake level, one individual displayed signs of intoxication at 10,000 IU. That individual received a megadose that was supposed to provide vitamin D for an extended period of time.


Non-toxic levels of 10,000 IU are achieved naturally through sunlight exposure. This applies to modern humans and probably our Paleolithic ancestors. Yet, modern humans normally limit their sun exposure and intake of vitamin D to levels (400 IU) that are only effective to avoid osteomalacia, the softening of the bones due to poor mineralization.

Very likely the natural production of 10,000 IU based on sunlight was adaptive in our evolutionary past, and also necessary for good health today. This is consistent with the many reports of diseases associated with chronic vitamin D deficiency, even at levels that avoid osteomalacia. Among those diseases are: hypertension, tuberculosis, various types of cancer, gingivitis, multiple sclerosis, chronic inflammation, seasonal affective disorder, and premature senescence.

Reference:

Reinhold Vieth (May 1999). Vitamin D supplementation, 25-hydroxyvitamin D concentrations, and safety. American Journal of Clinical Nutrition, Vol. 69, No. 5, 842-856.

Thursday, February 4, 2010

How much vitamin D? Vitamin D Council's recommendations

Since my recent post on problems related to vitamin D deficiency and excess I received several questions. I have also participated in several discussions in other blogs related to vitamin D in the past few days.

There is a lot of consensus about vitamin D deficiency being a problem, but not much about vitamin D in excess being a problem as well.

Some bloggers recommend a lot of supplementation, which may be dangerous because: (a) our body evolved to obtain most of its vitamin D from a combination of sunlight exposure and cholesterol, and thus body accumulation regulation mechanisms are not designed to deal with excessive oral supplementation; and (b) vitamin D, like many fat-soluble vitamins, accumulates in fat tissue over time, and is not easily eliminated by the body when in excess.

The Vitamin D Council has the following general recommendation regarding supplementation:
Take an average of 5,000 IU a day, year-round, if you have some sun exposure. If you have little, or no, sun exposure you will need to take at least 5,000 IU per day. How much more depends on your latitude of residence, skin pigmentation, and body weight. Generally speaking, the further you live away from the equator, the darker your skin, and/or the more you weigh, the more you will have to take to maintain healthy blood levels.
They also provide a specific example:
For example, Dr. Cannell lives at latitude 32 degrees, weighs 220 pounds, and has fair skin. In the late fall and winter he takes 5,000 IU per day. In the early fall and spring he takes 2,000 IU per day. In the summer he regularly sunbathes for a few minutes most days and thus takes no vitamin D on those days in the summer.
For those who have problems with supplementation, here is what Dr. Cannell, President of the Vitamin D Council, has to say:
For people who have trouble with supplements, I recommend sunbathing during the warmer months and sun tanning parlors in the colder months. Yes, sun tanning parlors make vitamin D, the most is made by the older type beds. Another possibility is a Sperti vitamin D lamp.
One thing to bear in mind is that if your diet is rich in refined carbohydrates and sugars, you need to change that before you are able to properly manage your vitamin D levels. You need to remove refined carbohydrates and sugars from your diet. No more white bread, bagels, doughnuts, table sugar, sodas sweetened with high-fructose corn syrup; just to name a few of the main culprits.

In fact, a diet rich in refined carbohydrates and sugars, in and of itself, may be one of the reasons of a person''s vitamin D deficiency in the case of appropriate sunlight exposure or dietary intake, and even of excessive levels of vitamin D accumulating in the body in the case of heavy supplementation.

The hormonal responses induced by a diet  rich in  refined carbohydrates and sugars promote fat deposition and, at the same time, prevent fat degradation. That is, you tend to put on body fat easily, and you tend to have trouble burning that fat.

This causes a "hoarding" effect which leads to an increase in vitamin D stored in the body, and at the same time reduces the levels of vitamin D in circulation. This is because vitamin D is stored in body fat tissue, and has a long half-life, which means that it accumulates (as in a battery) and then slowly gets released into the bloodstream for use, as body fat is used as a source of energy.

It should not be a big surprise that vitamin D deficiency problems correlate strongly with problems associated with heavy consumption of refined carbohydrates and sugars. Both lead to symptoms that are eerily similar; several of which are the symptoms of the metabolic syndrome.

Sunday, January 31, 2010

Vitamin D deficiency, seasonal depression, and diseases of civilization

George Hamilton admits that he has been addicted to sunbathing for much of his life. The photo below (from: phoenix.fanster.com), shows him at the age of about 70. In spite of possibly too much sun exposure, he looks young for his age, in remarkably good health, and free from skin cancer. How come? Maybe his secret is vitamin D.


Vitamin D is a fat-soluble pro-hormone; not actually a vitamin, technically speaking. That is, it is a substance that is a precursor to hormones, which are known as calcipherol hormones (calcidiol and calcitriols). The hormones synthesized by the human body from vitamin D have a number of functions. One of these functions is the regulation of calcium in the bloodstream via the parathyroid glands.

The biological design of humans suggests that we are meant to obtain most of our vitamin D from sunlight exposure. Vitamin D is produced from cholesterol as the skin is exposed to sunlight. This is one of the many reasons (see here for more) why cholesterol is very important for human health.

Seasonal depression is a sign of vitamin D deficiency. This often occurs during the winter, when sun exposure is significantly decreased, a phenomenon known as seasonal affective disorder (SAD). This alone is a cause of many other health problems, as depression (even if it is seasonal) may lead to obesity, injury due to accidents, and even suicide.

For most individuals, as little as 10 minutes of sunlight exposure generates many times the recommended daily value of vitamin D (400 IU), whereas a typical westernized diet yields about 100 IU. The recommended 400 IU (1 IU = 25 ng) is believed by many researchers to be too low, and levels of 1,000 IU or more to be advisable. The upper limit for optimal health seems to be around 10,000 IU. It is unlikely that this upper limit can be exceeded due to sunlight exposure, as noted below.

Cod liver oil is a good source of vitamin D, with one tablespoon providing approximately 1,360 IU. Certain oily fish species are also good sources; examples are herring, salmon and sardines. For optimal vitamin and mineral intake and absorption, it is a good idea to eat these fish whole. (See here for a post on eating sardines whole.)

Periodic sun exposure (e.g., every few days) has a similar effect to daily exposure, because vitamin D has a half-life of about 25 days. That is, without any use by the body, it would take approximately 25 days for vitamin D levels to fall to half of their maximum levels.

The body responds to vitamin D intake in a "battery-like" manner, fully replenishing the battery over a certain amount of time. This could be achieved by moderate (pre-sunburn) and regular sunlight exposure over a period of 1 to 2 months for most people. Like most fat-soluble vitamins, vitamin D is stored in fat tissue, and slowly used by the body.

Whenever sun exposure is limited or sunlight scarce for long periods of time, supplementation may be needed. Excessive supplementation of vitamin D (i.e., significantly more than 10,000 IU per day) can cause serious problems, as the relationship between vitamin D levels and health complications follows a U curve pattern. These problems can be acute or chronic. In other words, too little vitamin D is bad for our health, and too much is also bad.

The figure below (click on it to enlarge), from Tuohimaa et al. (2009), shows two mice. The one on the left has a genetic mutation that leads to high levels of vitamin D-derived hormones in the blood. Both mice have about the same age, 8 months, but the mutant mouse shows marked signs of premature aging.


It is important to note that the skin wrinkles of the mice on the left have nothing to do with sun exposure; they are associated with excessive vitamin D-derived hormone levels in the body (hypervitaminosis D) and related effects. They are a sign of accelerated aging.

Production of vitamin D and related hormones based on sunlight exposure is tightly regulated by various physiological and biochemical mechanisms. Because of that, it seems to be impossible for someone to develop hypervitaminosis D due to sunlight exposure. This does NOT seem to be the case with vitamin D supplementation, which can cause hypervitaminosis D.

In addition to winter depression, chronic vitamin D deficiency is associated with an increased risk of the following chronic diseases: osteoporosis, cancer, diabetes, autoimmune disorders, hypertension, and atherosclerosis.

The fact that these diseases are also known as the diseases of civilization should not be surprising to anyone. Industrialization has led to a significant decrease in sunlight exposure. In cold weather, our Paleolithic ancestors would probably seek sunlight. That would be one of their main sources of warmth. In fact, one does not have to go back that far in time (100 years should be enough) to find much higher average levels of sunlight exposure than today.

Modern humans, particularly in urban environments, have artificial heating, artificial lighting, and warm clothes. There is little or no incentive for them to try to increase their skin's sunlight exposure in cold weather.

References:

W. Hoogendijk, A. Beekman, D. Deeg, P. Lips, B. Penninx. Depression is associated with decreased 25-hydroxyvitamin-D and increased parathyroid hormone levels in old age. European Psychiatry, Volume 24, Supplement 1, 2009, Page S317.

P. Tuohimaa, T. Keisala, A. Minasyan, J. Cachat, A. Kalueff. Vitamin D, nervous system and aging. Psychoneuroendocrinology, Volume 34, Supplement 1, December 2009, Pages S278-S286.