When I was in high school, one of my best friends was a long-distance runner and a dancer. After only a few months of training, I knew something was wrong. She changed her diet to one of protein and almost no other calories. She was obsessed with exercise leading to a loss of many of her friends. Later on she lost a lot of weight and, to me, instead of becoming healthier she appeared to look pretty unhealthy.
What I didn't know then was that my friend may have suffered from the "female athlete triad". It is a three-part syndrome that affects the health and performance of female athletes and includes osteoporosis, disordered eating and menstrual disorders. Each of these are inter-related and inter-play. Together they can cause serious illness or death.
Writing in a review in British Medical Journal, Dr. Karen Birch explains that the syndrome can be caused by pressures psychological and physiological associated with a sports requirements to perform optimally, which can lead to a perception of needing a "low body mass, result of high-volume training" (1).
Being somewhat controversial, at least one medical researcher has called for abandonment of the syndrome. Dr. Michael Cullen of the British Association of Sport and Exercise Medicine points out that the term "blurs the concepts of a true eating disorder with that of a driven athlete who is simply ignorant of nutritional demands" and that osteoporosis in atheletes is rare (2).
Despite whether a syndrome should be recognized or not, clinicians should continue to recognize which women are most at risk, which are teen girls and female athletes of many kinds, especially where body image counts: gymnasts, figure skaters, ballerinas, swimmers, endurance runners, and so on (3).
The first signs of the female athlete triad may be low-calorie dieting or exercising to excess or obsession (3). The low-calcium diet contributes to low bone density. If amenorrhea results, it may be linked to decreased estrogen levels (3). It has also been my experience that smoking usually is another sign of an eating disorder among teens. The reasons why is because the teens see it as an effective method to control appetite and weight (4). Unfortunately, for a teen suffering already from female athlete triad, smoking can cause an exacerbated loss of bone (5 & 6). The impact of female athlete triad can lead to infertility and stress fractures in the future (1).
References
1. Birch K. Female athlete triad. ABC of sports and exercise medicine. British Medical Journal. Available at: http://www.bmj.com/cgi/content/extract/330/7485/244.
2. Cullen M. et al. 10 Feb 2005. The Female Athlete Triad. Available at: al.http://www.bmj.com/cgi/content/extract/330/7485/244.
3. WebMD. The Female Athlete Triad. Available at: http://www.webmd.com/a-to-z-guides/female-athlete-triad.
4. http://www.ncbi.nlm.nih.gov/pubmed/17056404
5. Gropper SS, Smith JL, Groff JL. Advanced Nutrition and Human Metabolism. Belmont, CA: Thomson Wadsworth, 2009.
6. http://www.ausport.gov.au/participating/women/issues/osteo
Sunday, December 27, 2009
Thursday, December 24, 2009
Growth hormone: The fountain of youth
Growth hormone, also known as human growth hormone, seems to be implicated in a number of metabolic conditions associated with aging, and, more generally, poor health.
In adults, growth hormone deficiency is associated with: decreased calcium retention and osteoporosis, loss of muscle mass, increased fat deposition, decreased protein synthesis, and immunodeficiency. In children, growth hormone deficiency is associated with stunted growth.
Levels of growth hormones decline with age, and their decrease is believed to contribute to the aging process. Abdominal obesity is associated with low levels of growth hormone, and is also associated with the onset of the metabolic syndrome, a precursor of diabetes and cardiovascular disease.
While there are many treatments in the market that include exogenous administration of growth hormones (e.g., through injection), there are several natural ways in which growth hormone levels can be increased. These natural ways can often lead to more effective and sustainable results than prescription drugs.
For example, fasting stimulates the natural production of growth hormone. So does vigorous exercise, particularly resistance exercise with a strong anaerobic component (not cardio though). And, to the surprise of many people, deep sleep stimulates the natural production of growth hormone, perhaps more than anything else. (Although only once every 24 hours; sleeping all day does not seem to work.)
In fact, during a 24-hour period, growth hormone typically varies in pulses, or cycles. The pulses are somewhat uniformly distributed during the day, with a peak occurring at night. The graph below (source: Fleck & Kraemer, 2004) plots the typical variation of growth hormone during a 12-hour period, including the deep sleep period.
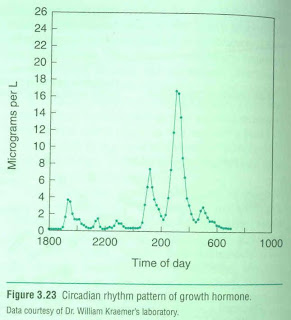
As you can see, growth hormone peaks during deep sleep; which is achieved a few hours after one goes to bed, and not too long before one wakes up.
By the way, if you want to know more about human physiology and metabolism, forget about popular diet and exercise books. Next to peer-reviewed academic articles (which are often hard to read), the best sources are college textbooks used in courses on physical education, nutrition, endocrinology, and related topics. The book from which the graph above was taken (Fleck & Kraemer, 2004), is a superb example of that.
Reference:
Fleck, S.J., & Kraemer, W.J. (2004). Designing resistance training programs. Champaign, IL: Human Kinetics.
Wednesday, December 23, 2009
Half-hearted Atkins diet and cardiovascular disease
I would like to comment on a recent article comparing the Atkins, Ornish and South Beach
An excellent post by Michael Eades clarifies a number of issues with the study, including what one could argue is the study's main flaw. Apparently the study compared a half-hearted Atkins diet, with probably equally half-hearted Ornish andSouth Beach
I refer to the study's Atkins diet as half-hearted because it seems to rely on a daily consumption of between 120 and 180 grams of carbohydrates. This is unlikely to lead to ketosis, the cornerstone of the Atkins diet, where the body uses ketone bodies (made from dietary as well as body fat) as a source of energy.
As I see it, the main findings of the study were that the participants in the half-hearted Atkins diet, after a period of 4 weeks on the diet, and when compared with the participants in the other diets, had: (a) greater levels of total cholesterol and LDL cholesterol, with only a small improvement in their HDL cholesterol and triglycerides levels; and (b) greater levels of markers for inflammation (e.g., C-reactive protein).
The participants were young and healthy. Their average age was 30.6 years, and their average body mass index was 22.6. On average, their total cholesterol was 184.9 mg/dL, triglycerides were 78.1 mg/dL, LDL cholesterol was 107.2 mg/dL, and HDL cholesterol was 62.2 mg/dL. These are arguably fairly healthy numbers; although quite a few doctors might want to put most of these folks preventively on statins because of their LDL being greater than 100.
What I find interesting about this study, and consistent with both my own experience and also a theory that I have, is that it suggests that a low carb. diet has to really be low carb. in order to bring about the benefits that one normally sees as a result of a diet that induces ketosis. A diet with, say, > 150 g of refined grains per day, is not really a low carb. diet.
Again, in my experience, and that of many other people, a truly low carb. diet (very low in, if not devoid of, refined carbs and sugars), will lead to an impressive increase in HDL cholesterol (especially for those who have low HDL to start with), an equally impressive decrease in triglycerides, increased insulin sensitivity, and possibly a decrease in LDL.
However, a half-hearted Atkins diet may actually lead to elevated LDL (of the small-dense type), and more inflammation, just like this study suggests it does, without the benefits regarding HDL and trigs. The reason is that the still relatively high level of carbohydrate intake, especially if it comes in the form of refined carbs. and sugars, will lead to higher levels of insulin being secreted into the bloodstream. This will promote increased body fat deposition. The extra saturated fat being consumed will be turned into body fat, and not used as energy, starving the cells and leading to increased hunger.
A diet rich in saturated fat may indeed be bad when it is also a diet even moderately rich in insulin-boosting, easily digestible carbs. This may be one of the main reasons why there have been so many studies in the past showing a correlation between saturated fat consumption and heart disease; studies that typically did not control for carbohydrate consumption.
In a recent interview on the Livin' La Vida Low-Carb Blog, Dr. John Salerno goes into more detail regarding this issue, recommending a much more rigid adoption of the Atkins diet than many think is okay. (In fact, I often talk to people who think that if they cut a very high carb. intake in half - e.g., from 400 to 200 grams per day - replacing the carbs with fat, they will be halfway into a full blown Atkins diet.) Dr. Salerno has worked in the past with Dr. Atkins. He calls his diet the Silver Cloud Diet. I am not sure I agree with all that Dr. Salerno had to say, but his argument in favor of a diet very low in carbs. does make sense to me.
Finally, I think that it is dangerous to extrapolate the results of any study, no matter how comprehensive, to the population in general. Each individual is unique in terms of his or her genetic makeup and life history; the latter also influences metabolic patterns. (Even identical twins raised together may display different metabolic patterns, because of their different life histories.) So, while a low carb. diet may work well for a lot of people, it may have very negative effects on a few. Increases in inflammation markers and adverse effects on LDL cholesterol (especially when LDL is measured directly, accounting for particle numbers and sizes) are warning signs that any low carb. dieter should pay attention to.
Reference:
Miller, M. et al. (2009). Comparative effects of three popular diets on lipids, endothelial function, and c-reactive protein during weight maintenance. Journal of the American Dietetic Association, 109, 713-717.
An excellent post by Michael Eades clarifies a number of issues with the study, including what one could argue is the study's main flaw. Apparently the study compared a half-hearted Atkins diet, with probably equally half-hearted Ornish and
I refer to the study's Atkins diet as half-hearted because it seems to rely on a daily consumption of between 120 and 180 grams of carbohydrates. This is unlikely to lead to ketosis, the cornerstone of the Atkins diet, where the body uses ketone bodies (made from dietary as well as body fat) as a source of energy.
As I see it, the main findings of the study were that the participants in the half-hearted Atkins diet, after a period of 4 weeks on the diet, and when compared with the participants in the other diets, had: (a) greater levels of total cholesterol and LDL cholesterol, with only a small improvement in their HDL cholesterol and triglycerides levels; and (b) greater levels of markers for inflammation (e.g., C-reactive protein).
The participants were young and healthy. Their average age was 30.6 years, and their average body mass index was 22.6. On average, their total cholesterol was 184.9 mg/dL, triglycerides were 78.1 mg/dL, LDL cholesterol was 107.2 mg/dL, and HDL cholesterol was 62.2 mg/dL. These are arguably fairly healthy numbers; although quite a few doctors might want to put most of these folks preventively on statins because of their LDL being greater than 100.
What I find interesting about this study, and consistent with both my own experience and also a theory that I have, is that it suggests that a low carb. diet has to really be low carb. in order to bring about the benefits that one normally sees as a result of a diet that induces ketosis. A diet with, say, > 150 g of refined grains per day, is not really a low carb. diet.
Again, in my experience, and that of many other people, a truly low carb. diet (very low in, if not devoid of, refined carbs and sugars), will lead to an impressive increase in HDL cholesterol (especially for those who have low HDL to start with), an equally impressive decrease in triglycerides, increased insulin sensitivity, and possibly a decrease in LDL.
However, a half-hearted Atkins diet may actually lead to elevated LDL (of the small-dense type), and more inflammation, just like this study suggests it does, without the benefits regarding HDL and trigs. The reason is that the still relatively high level of carbohydrate intake, especially if it comes in the form of refined carbs. and sugars, will lead to higher levels of insulin being secreted into the bloodstream. This will promote increased body fat deposition. The extra saturated fat being consumed will be turned into body fat, and not used as energy, starving the cells and leading to increased hunger.
A diet rich in saturated fat may indeed be bad when it is also a diet even moderately rich in insulin-boosting, easily digestible carbs. This may be one of the main reasons why there have been so many studies in the past showing a correlation between saturated fat consumption and heart disease; studies that typically did not control for carbohydrate consumption.
In a recent interview on the Livin' La Vida Low-Carb Blog, Dr. John Salerno goes into more detail regarding this issue, recommending a much more rigid adoption of the Atkins diet than many think is okay. (In fact, I often talk to people who think that if they cut a very high carb. intake in half - e.g., from 400 to 200 grams per day - replacing the carbs with fat, they will be halfway into a full blown Atkins diet.) Dr. Salerno has worked in the past with Dr. Atkins. He calls his diet the Silver Cloud Diet. I am not sure I agree with all that Dr. Salerno had to say, but his argument in favor of a diet very low in carbs. does make sense to me.
Finally, I think that it is dangerous to extrapolate the results of any study, no matter how comprehensive, to the population in general. Each individual is unique in terms of his or her genetic makeup and life history; the latter also influences metabolic patterns. (Even identical twins raised together may display different metabolic patterns, because of their different life histories.) So, while a low carb. diet may work well for a lot of people, it may have very negative effects on a few. Increases in inflammation markers and adverse effects on LDL cholesterol (especially when LDL is measured directly, accounting for particle numbers and sizes) are warning signs that any low carb. dieter should pay attention to.
Reference:
Miller, M. et al. (2009). Comparative effects of three popular diets on lipids, endothelial function, and c-reactive protein during weight maintenance. Journal of the American Dietetic Association, 109, 713-717.
Sunday, December 20, 2009
Family influence on meals
My thoughts after reading "A Review of Family Meal Influence on Adolescents' Dietary Intake" by Sarah Woodruff and Rhona Hanning:
It's pretty easy to imagine why having dinner with one's family would instill positive nutritional habits. Even the word family exudes in its meaning what goes further to credit an environment of caring and, above all, nurturing.
When mother and father are at the table, they are naturally given to see to it that their children are eating well. At the same time, they must also set the right example. Thus, it's clear why the authors of the article found that the studies reviewed found that those adolescents who ate with their families had a higher intake dairy, fruits and vegetables.
I would further suggest that family influence comes with wisdom as to healthy eating pattens. For example, when grandma or grandpa or mom or dad make a meal, they themselves are passing on food traidtions that may have well sustained generations with better health. When family is not available and adolescents are left to choose their own eating patterns, one could imagine they're much more inclined to make poorer choices as they have to "reinvent the wheel" so to say.
One element I would have liked to have seen the article address with more detail was actual preapartion of food. It's my own experience that a personal relationship with food can go a long way in how nutritious it is to a person. You might call it a greater food consciousness--more understanding of what's about to be eaten. Food consciousness is often lost on teens when going out to eat or when leaning on the microwave meals. When a teen prepares his or her own food, just the creativity itself involved by choice and cooking is likely to play a factor in actual nutrition.
Saturday, December 19, 2009
Total cholesterol and cardiovascular disease: A U-curve relationship
The hypothesis that blood cholesterol levels are positively correlated with heart disease (the lipid hypothesis) dates back to Rudolph Virchow in the mid-1800s.
One famous study that supported this hypothesis was Ancel Keys's Seven Countries Study, conducted between the 1950s and 1970s. This study eventually served as the foundation on which much of the advice that we receive today from doctors is based, even though several other studies have been published since that provide little support for the lipid hypothesis.
The graph below (source: canibaisereis.com, with many thanks to O Primitivo) shows the results of one study, involving many more countries than Key's Seven Countries Study, that actually suggests a NEGATIVE linear correlation between total cholesterol and cardiovascular disease.
Now, most relationships in nature are nonlinear, with quite a few following a pattern that looks like a U-curve (plain or inverted); sometimes called a J-curve pattern. The graph below (source also: canibaisereis.com) shows the U-curve relationship between total cholesterol and mortality, with cardiovascular disease mortality indicated through a dotted red line at the bottom.
 This graph has been obtained through a nonlinear analysis, and I think it provides a better picture of the relationship between total cholesterol (TC) and mortality. Based on this graph, the best range of TC that one can be at is somewhere between 210, where cardiovascular disease mortality is minimized; and 220, where total mortality is minimized.
The total mortality curve is the one indicated through the full blue line at the top. In fact, it suggests that mortality increases sharply as TC decreases below 200.
Now, these graphs relate TC with disease and mortality, and say nothing about LDL cholesterol (LDL). In my own experience, and that of many people I know, a TC of about 200 will typically be associated with a slightly elevated LDL (e.g., 110 to 150), even if one has a high HDL cholesterol (i.e., greater than 60).
Yet, most people who have a LDL greater than 100 will be told by their doctors, usually with the best of the intentions, to take statins, so that they can "keep their LDL under control". (LDL levels are usually calculated, not measured directly, which itself creates a whole new set of problems.)
Alas, reducing LDL to 100 or less will typically reduce TC below 200. If we go by the graphs above, especially the one showing the U-curves, these folks' risk for cardiovascular disease and mortality will go up - exactly the opposite effect that they and their doctors expected. And that will cost them financially as well, as statin drugs are expensive, in part to pay for all those TV ads.
One famous study that supported this hypothesis was Ancel Keys's Seven Countries Study, conducted between the 1950s and 1970s. This study eventually served as the foundation on which much of the advice that we receive today from doctors is based, even though several other studies have been published since that provide little support for the lipid hypothesis.
The graph below (source: canibaisereis.com, with many thanks to O Primitivo) shows the results of one study, involving many more countries than Key's Seven Countries Study, that actually suggests a NEGATIVE linear correlation between total cholesterol and cardiovascular disease.

Now, most relationships in nature are nonlinear, with quite a few following a pattern that looks like a U-curve (plain or inverted); sometimes called a J-curve pattern. The graph below (source also: canibaisereis.com) shows the U-curve relationship between total cholesterol and mortality, with cardiovascular disease mortality indicated through a dotted red line at the bottom.

The total mortality curve is the one indicated through the full blue line at the top. In fact, it suggests that mortality increases sharply as TC decreases below 200.
Now, these graphs relate TC with disease and mortality, and say nothing about LDL cholesterol (LDL). In my own experience, and that of many people I know, a TC of about 200 will typically be associated with a slightly elevated LDL (e.g., 110 to 150), even if one has a high HDL cholesterol (i.e., greater than 60).
Yet, most people who have a LDL greater than 100 will be told by their doctors, usually with the best of the intentions, to take statins, so that they can "keep their LDL under control". (LDL levels are usually calculated, not measured directly, which itself creates a whole new set of problems.)
Alas, reducing LDL to 100 or less will typically reduce TC below 200. If we go by the graphs above, especially the one showing the U-curves, these folks' risk for cardiovascular disease and mortality will go up - exactly the opposite effect that they and their doctors expected. And that will cost them financially as well, as statin drugs are expensive, in part to pay for all those TV ads.
Friday, December 18, 2009
Stop Measuring and Start Thinking
Stop Measuring and Start Thinking
I recently wrote a paper suggesting that the arts might just offer us the most potent means of questioning the grotesque market-driven society that we live in, a society that insists on measuring everything in terms of cost-benefit-analysis.
In this paper that will be published shortly, I suggested that the arts not only offer us a means of questioning the world, and imposing some sort of order on the chaos that surrounds us; but that popular culture too, offers a potent part to play in the arts/health agenda. For those of you interested in popular culture and public health I’d like to recommend the writing of Mark Burns and his Sex and Drugs and Rock and Health, which can be found at www.sexanddrugsandrockandhealth.com
Since the global downturn, lots of economists have been talking of creative approaches to their work; whatever that might mean. To be honest; it makes me slightly nervous. Consumerism, to which we’re all in some way addicted, has infected all aspects of society. In the art world itself, the hyper-inflated egos and prices associated particularly with ‘Brit Art’ reflects elitism, consumerism and our obsession with celebrity culture.
Over the past thirty years, market forces have been the governing philosophy of how we live our lives, and over the last 12 months we’ve seen how imposing market values on all elements of human life has terrible consequences. The impact of mental illness in dominant, unequal societies offer some stark financial facts, with doctors in England in 2005 writing 29 million prescriptions for anti-depressant drugs, costing over £400 million to the NHS 1 and in 2003, the USA spent more than $100 billion on mental health treatments. 2
Across the North West I’ve experienced some amazing practice in the arts and seen the impact participating can have on people and yet I’m constantly asked for hard unequivocal evidence as to its value. In his Reith Lectures for the BBC this year Michael Sandel, Harvard Professor of Government, invites us to think of ourselves, less as consumers and more as citizens, and argues for politics of the common good where commodities of community, solidarity and trust are not commodities that deplete with use, like our finite environmental or economic resources, but are more like muscles, that grow stronger with exercise. These wonderful and relevant lectures can be listened to at www.bbc.co.uk/programmes/b00kt7sh
So, do we really need to weigh, measure and count everything we do to justify the arts?
After recently giving the paper in which I expanded on these themes, there followed a discussion that turned to the work I’m supporting around a National Forum for Arts and Health. This was about ‘strategy’ and ‘manifestos’ and I could feel the delegates’ eyes beginning to glaze.
Whatever statements and strategies we develop around the arts in relation to society and well-being, they’re going to date and stagnate on a thousand groaning shelves.
As a student, I always loved the pompous and extreme nature of artists’ manifestos (think Marinetti)… ‘we have been discussing right up to the limits of logic and scrawling the paper with demented writing.’3
Perhaps when we look to manifestos and pamphleteering, we should take a slightly more provocative stance. I’d like to recommend two pieces of art that I put forward as manifestos in their own right.
The first is Jonathon Swift and his Modest Proposal,4 written in 1729. This was a stinging satire in the form of a pamphlet. In the guise of a well-intentioned economist, Swift proposed a solution to the poverty and inequity of the time, by suggesting the rich purchase and eat the children of the poor. Monstrous and politically loaded, this is as biting and as powerful as the written word gets. A manifesto? Perhaps not, but an artist at the height of his powers exploiting popular culture (pamphleteering) to attack and question the norms.
As a counter-blast to Swift’s, Modest Proposal, I’d like to offer Sam Taylor-Wood’s, Still Life5 , a 3 minute 44 second film. This film of a bowl of fruit slowly decomposing is very much in the lines of an elegant still life typical of 16th and 17th century painting of the Netherlands. As the fruit slowly transforms to a mass, a cheap and throwaway, plastic ballpoint pen in the foreground, remains static and unchanged
I urge you to try and see this work. There are 6 of them out there including one at Tate Modern. Of course youtube have a few, but they don’t do it justice. I shall leave you to form your own opinion of what the work’s about and what relevance it might have to our practice and the issues facing society. For me, this work speaks far more loudly than any strategy or conscious manifesto.
1. Hansard. Written answers to questions, (2005) 439:22 Nov. 2005: Column 1798w
2. Mark, T.L et al. Mental Health Treatment Expenditure Trends, 1986 – 2003, Psychiatric Services (2007) 58 (8): 1041 – 8.
3. F.T. Marinetti, The Futurist Manifesto, 1909
4. A Modest Proposal: For Preventing the Children of Poor People in Ireland from Being a Burden to Their Parents or Country, and for Making Them Beneficial to the Publick.
5. Sam Taylor-Wood, Still Life, 2001, Edition of 6, 35 mm Film/DVD
Monday, December 14, 2009
What's an ALT test?
Alanine aminotransferase (ALT) is an enzyme that is concentrated in the hepatocytes. When the liver is injured or affected by disease, the enzyme is released into the bloodstream. When jaundice occurs, for example, elevated ALT levels can distinguish a liver injury or disease instead of red blood cell hemolysis.
The test is performed on a patient by collecting 7-10 mL of blood in a red-top tube, then sending it to a lab for analysis. If a patient does have liver dysfunction, then the clinician should note that bleeding times may be longer.
Significantly elevated ALT levels may indicate hepatits, hepatitis necrosis or hepatits ischemia. Moderately increased levels may indicate cirrhosis, cholestatis, a hepatic tumor, a hepatotoxic drug, obstructive jaundice, severe burns or trauma to striated muscle. Drugs that may elevate ALT levels include acetaminophens, clofibrate, codeine, salicylates, tetracyclines among many others.
ALT levels may also increase to a lesser extent due to myositis, acute pancreatitis, myocardial infarction, mononucleosis or shock.
Summarized from the following:
Pagana, K.D., Pagana, T.J. Mostby's Manual of Diagnostic and Laboratory Tests, 3rd ed. Mosby Elsvier, 2006, pp. 40-42.
Lee RD, Nieman DC. Nutritional Assessment. New York: McGraw-Hill, 2007.
Sunday, December 13, 2009
When You Have an Abnormal Lipid Profile
An abnormal lipid profile is a consistent indicator of atherosclerosis and cardiovascular disease (CHD). Blood lipids include total cholesterol, LDL-C, HDL-C and triglycerides. Because each of these factors are ultimately affected by diet, it serves to reason to recommend dietary strategies to help lower total cholesterol and LDL-C, increase HDL-C and reduce triglyceride levels.
ATP III uses the term therapeutic lifestyle changes (TLC) for recommendations that can help to improve abnormal lipid profiles and reduce risk of CHD. TLC makes recommendations for saturated fat (less than 7% of total calories), polyunsaturated fat (up to 10% of total calories), monounsaturated fat (up to 20% of total calories), total fat (25-35% of total calories, fiber (20-30g/d), protein (approx. 15% of total calories), and cholesterol (less than 200 mg/d). The total calories recommendation, in addition, is based on a balance of energy intake and expenditure to maintain a healthy weight (1).
Because it is often difficult for patients to adhere to specific percentages, a nutritionist can help patients by summarizing recommendations as eating less to lose weight as appropriate, exercising regularly as appropriate, avoiding animal fats in keeping to a low-cholesterol diet, replacing saturated fats with polyunsaturated fats whenever possible, and eating more fruits and vegetables.
A nutritionist could also approach patients with a Mediterranean-style diet. Recent research is showing that this diet is appropriate because it represents many of the same diet recommendations included in TLC. This diet may also have lipid-lowering effects and cardio-protective benefits from the regular intake of red wine, olive oil and fish (2).
Reference List
1. Lee RD, Nieman DC. Nutritional Assessment. New York: McGraw-Hill, 2007.
2. Cheskin LJ, Kahan S. Low-carbohydrate and Mediterranean diets led to greater weight loss than a low-fat diet in moderately obese adults. Evid Based Med 2008;13:176.
When should prevention of atherosclerosis start?
I have three children, one boy, 13 and two girls, 10 and 11. As far as I’m concerned prevention of atherosclerosis should begin as early as possible. That means yesterday. However, I understand that there exists some uncertainty of exactly what age to begin prevention. It has to do partly with juvenile fatty streaks. What may appear unimaginable is that the occurrence of juvenile fatty streaks somehow may have an importance in child development.
Most North American children develop fatty streaks in their aortas by age 3 and in coronary arteries along with macrophage foam cells by age 10 (1); by the time children are reaching puberty, they may already have developed fatty streak lesions. Fatty streaks are nothing new. As offered by McGill et al, our hominin forebears likely developed them as do current non-human Old and New World primates even when living in natural habitats. Studies of other mammals reveal that many of them also develop fatty streaks.
From an evolutionary perspective, then, fatty streaks may have provided a selective advantage to pre-human or human ancestors. Or, as in most cases, there are “trade-offs” in evolution. What may have been a cause of poor health in the long run for human ancestors may have been important part of early development. Fats and calories, for example, may have helped a child's brain or muscle development (3). It also stands to reason that while fatty streaks are normal, they may not necessarily lead to atherosclerosis. Wild mice develop fatty streaks, for example, but won’t develop lesions. Caged mice on a high-fat/cholesterol diet, however, will develop lesions and atherosclerosis as they age (2). When comparisons are given of mice and men (or women), our modern “caged” sedentary lifestyles and high-fat/cholesterol diets suggest humans are a burden to their own health.
Long-range prevention, then, should be focused on encouraging an improved diet early. How early? The American Heart Association’s guidelines suggest starting children on a widely varied diet low in fat and calories by age 2 (4). The amounts of fats and calories, however, must take child development into consideration. Even once children reach puberty this should be the case. As with my own children, who I have on a Mediterranean-style DASH diet rich in fats from olive oil and fish, it is important to give the body a holistic approach.
Reference List
1. McGill HC, Jr., McMahan CA, Herderick EE, Malcom GT, Tracy RE, Strong JP. Origin of atherosclerosis in childhood and adolescence. Am J Clin Nutr 2000;72:1307S-15S.
2. Li Y, Gilbert TR, Matsumoto AH, Shi W. Effect of aging on fatty streak formation in a diet-induced mouse model of atherosclerosis. J Vasc Res 2008;45:205-10.
3. Mitchell MK. Nutrition Across the Life Span. "Chapter 9: Nutrition During Growth: Preschool through Preadolescence". Second Edition. Waveland Press: Long Grove, Illinois, 2003, pp. 271-300.
4. Lee RD, Nieman DC. Nutritional Assessment. New York: McGraw-Hill, 2007.
Tuesday, December 8, 2009
Refined carbs, sugar, and cholesterol: My own experience
A few years ago I went to the doctor for a routine appointment, and I was told that my LDL cholesterol was elevated. I was in my early 40s. My lipid profile was the following - LDL: 156, HDL: 38, triglycerides: 188. The LDL was calculated. I was weighing about 210 lbs, which was too high for my height (5 ft 8 in). My blood pressure was low, as it has always been - systolic: 109, diastolic: 68.
My doctor gave me the standard advice in these cases: exercise, lose weight, and, most importantly, reduce your intake of saturated fat. I was also told that I would probably have to take statins, as my high LDL likely had something to do with my genetic makeup. Again, this is quite standard, and we see it all over the place, particularly in commercials for statins.
I told my doctor that I would do some research on the topic, which I am going to save for other posts. Let me get to the point, by telling you what my lipid profile is today - LDL: 123, HDL: 66, triglycerides: 46. Again, the LDL value is calculated. I am weighing about 152 lbs now, with about 13 percent of body fat.
The HDL and triglycerides numbers above are shown in bold font because my research convinced me that these two numbers are the ones most people should really worry about when trying to address what is known as dyslipidemia. Here I am assuming that only standard lipid profiles are available; there are better alternatives, such as particle type analyses, which are not yet standard.
Many people who suffer from cardiovascular disease have low LDL cholesterol, but very few of those have high HDL cholesterol, which is one of the best predictors of cardiovascular disease among lipids. More specifically, if you have an HDL higher than 60, you have a very small chance of developing cardiovascular disease. (It can happen, but it is very unlikely, with a percentage chance in the single digits.)
Interestingly, low HDL cholesterol is also associated with the metabolic syndrome. This syndrome is characterized by the following:
- High fasting serum glucose (hyperglycemia), which is one of many signs of insulin resistance, a precursor to diabetes type 2;
- High blood pressure;
- Abdominal obesity (also known as pot or beer belly);
- Low HDL cholesterol; and
- Elevated triglycerides.
Now, you may ask, how did you increase your HDL? Well, I tried a number of things - diet and lifestyle changes - and had a blood test every 3 months. After a while I was able to put all of the measures in a spreadsheet table, and correlate them using a statistical software that I developed, to give me an idea of what was going on.
Weight was a big factor on LDL, and I was able to bring my weight down to 150 lbs and my LDL to below 100 at some point. For me, and many other people, body weight and LDL cholesterol are strongly and positively correlated (the higher the weight, the higher the LDL cholesterol - actually body fat seems to be the real culprit). Moreover, my LDL seemed to decrease more markedly when my weight was on the way down, and not as much when it was stable, even if low.
But the HDL would only increase if I increased my saturated fat intake. The problem is that every time I increased my saturated fat intake my LDL would go up; it reached 162 at one point, when my HDL went up to a modest but encouraging 47. That was my highest HDL until I eliminated refined carbs and sugars (e.g., bread, pasta, cereals, doughnuts, bagels, regular sodas) from my diet.
When I brought my intake of refined carbs and sugars down to zero, my intake of protein and saturated fat went up. Either that would happen, or I would starve, because you have to eat something. (I figured that I would not die by doing a low carb/high fat-protein experiment for 3 months to see what happened.) Also, I dramatically increased my dietary cholesterol - two to four eggs per day, organ meats, and seafood.
That is when my HDL shot up, to 66, and my LDL went down. Yes, my LDL levels seem to be negatively correlated with dietary saturated fat and cholesterol amounts, as long as I do not consume refined carbs and sugars. Moreover, it is very likely that my LDL particle size increased, and large LDL particles DO NOT cause atherosclerosis because they cannot penetrate the artery walls.
So, the bottom line is that, at least for me, an INCREASE in saturated fat and a DECREASE in refined carbs and sugars, happening together, seem to have taken me out of my previous path toward the metabolic syndrome.
Moreover, I feel a lot more energetic than before, my immune system seems to have gotten better at fighting disease, and even my pollen allergies are not as bad as they were before. Admittedly, these benefits may be strongly associated with the weight loss and the related reduction in body fat percentage.
I hope this post is helpful to others. The standard advice that people with high LDL cholesterol receive, which usually focuses on reducing saturated fat intake, has a big problem. When you reduce your intake of a type of food, you usually increase your intake of other types of food. Most people who try to reduce their saturated fat intake invariably increase their carb intake, usually with the wrong types of carb-rich foods (the man-made ones), simply because they go hungry.
Sunday, December 6, 2009
When to use a C-peptide test
Normally, measuring insulin directly is more accurate with diabetics. But C-peptide levels more accurately reflect islet cell function in situations of insulinomas as well as cases of diabetics taking exogenous insulin (for treatment or secretly).
C-peptide, short for "connecting peptide" is the protein connecting beta/alpha chains of proinsulin. The chains are separated when proinsulin becomes insulin and C-peptide. C-peptide ends up in equal amounts to insulin in the portal vein, lasts longer than insulin so can be found more readily in peripheral circulation, and correlates with insulin levels.
Summarized from
Pagana, K.D., Pagana, T.J. Mostby's Manual of Diagnostic and Laboratory Tests, 3rd ed. Mosby Elsvier, 2006, p. 197.
Why get a glycosylated hemoglobin test?
Measuring blood glucose periodically is critical for staying off the blood sugar rollercoaster. But how can a clinician be sure a patient hasn't gotten on board the rollercoaster? This is when glyosylated hemoglobin comes into the picture.
What happens is that when a person is diabetic and doesn't adequately control blood glucose, her or his blood glucose becomes elevated. The hyperglycemia that results begins to affect certain proteins in the blood as well as hemoglobin. Blood glucose bonds to the hemoglobin and it becomes "glycosylated". The glycosylation mainly happens to hemoglobin A (HbA, the major form of hemoglobin, and it's pretty much irreversible.
After a few weeks, the amount of glycosylated hemoglobin will decline, but only if blood sugar is controlled. If it's not controlled, then a physician can order a glycosylated HbAIC test, or AIC test. A person without diabetes should have about 4-8% HbAIC and the American Diabetes recommends diabetics to stay below at least 7%. The glycosylated hemoglobin test is meant to evaluate how well treatment is going and how well a patient is following recommendations. It also serves as a method to individualize programs, compare therapys, differentiate short-term hyperglycemia in nondiabetics and diabetics, and also to offer as a reward for patients who do well in their control.
Summarized from
Lee, R.D. & Nieman, D.C. Nutritional Assessment, 4th ed. McGraw Hill Higher Education. Boston, 2007, p. 307.
Pagana, K.D., Pagana, T.J. Mostby's Manual of Diagnostic and Laboratory Tests, 3rd ed. Mosby Elsvier, 2006, p. 282.
Baby Steven
John and Susan are both prone to being overweight. They are concerned that their infant son, Steven will also have weight problems. They are referred to you when Steven is 5 months old. Steven's growth data are as follows
Age Weight Length
Birth 8lb 20inches
1 week 8lb 1oz 20 inches
1 month ll lb. 21.5 inches
2 month 12lb 8oz 23 inches
3 month 14lb 8oz 23.5 inches
4 month 16lb 25.5 inches
5 month 18lb 26.5 inches
Steven breast feeds six times daily for about 20-25 minutes at each feeding. He is not presently receiving any other sources of nourishment. Answer the following questions for John and Susan:
Their pediatrician told them that Steven's weight is above average. Is he gaining too much weight?
When charted, Steven’s birth weight and weight gain for the next two months is at about the 50th percentile (1 p. 566). His weight gain afterward appears to be higher than average and he is at the 90th percentile by 5 months (1 p. 566). Steven’s birth length for four months is at about the 50th percentile and then flows upward slightly closer to the 75th percentile (1 p. 567).
Because Steven’s length is slightly higher than average, I would judge that it is the extra growth that may also explain the extra weight gain. The weight gain, then, is probably not at a level that should be worried about. I will agree with others who have replied that at this moment the primary concern should be making sure Steven’s fed well to best support his physical and neurodevelopment that occur in the first year of life (1 p. 216).
Should they delay adding solid foods or add something now? If they should add something, what would recommend?
At Steven’s age of 5 months, the appropriate foods to be supplying him are breast milk or formula, infant cereal and strained fruits and vegetables. He’ll be teething soon, so within two or three months, he’ll be able to enjoy strained meats and breads (1 . Within five to seven months, he’ll be chomping on chopped fruits, vegetables and meats. Steven ca be weaned around 2 to 3 years (1 p. 200).
Should they give Steven juice in a bottle?
No, they should not. According to the American Academy of Pediatrics, there is no reason why juice should be given to Steven at all based on nutritional considerations (2). This is the case even as he grows older. From my own experience with my children, I can tell you that juice, while sure to be fascinating to a baby’s taste buds, would simply turn into a habit whereby breast milk and formula are avoided.
In fact, my own mother tells me all the time that she wishes she never would have given me juice because, as a baby, I immediately stopped breastfeeding when I tried it. The fruit juice also displaced nutrition I could have received otherwise (1 p. 242). Eventually baby bottle tooth decay would also be my fate (1 p. 242).
A neighbor has suggested that Steven could be given skim milk instead of breast milk, Do you recommend this?
Steven’s breastfeeding of six times daily is normal for babies of 2-3 months (1 p. 239). Once reaching 3-6 months, the level normally should drop to 4-5 and he should be introduced to other foods as mentioned above (1 p. 239). Steven should not be given milk at all, be it raw, whole, 2% or skim. Breast milk is best because of its unique properties such as lactoferrin, immunoglobulins and the bifidus factor (1 p. 231-232). These are able to prevent allergies, asthma and infections over time (1 p. 231-232). Infant formula is acceptable, however, and, unlike cow’s milk, can also provide a commonly deficient nutrient in infants: iron (1 p.236). Infant formula is carefully formulated and fortified with vitamins, minerals and essential fats to best support child development (1 p. 235).
References
1. Mitchell MK. Nutrition Across the Life Span. "Chapter 9: Nutrition During Growth: Preschool through Preadolescence". Second Edition. Waveland Press: Long Grove, Illinois, 2003.
2. http://pediatrics.about.com/od/weeklyquestion/a/0806_baby_juice.htm
Subscribe to:
Posts (Atom)